
- Start >
- Rivers >
- Waterlevel >
- Oberer Main - Elbe >
- Hammerles >
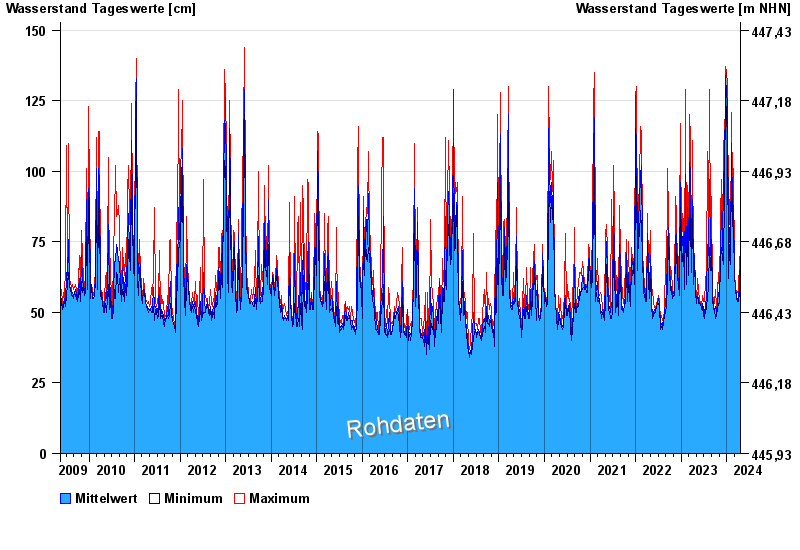
- Chart of total period

Chart of total period Hammerles / Schweinnaab
Waterlevel from 17.05.2009 to 20.04.2024
| Date | Mean value [cm] | Maximum [cm] | Minimum [cm] |
|---|---|---|---|
| 20.04.2024 | 72 | 72 | 70 |
| 19.04.2024 | 62 | 72 | 59 |
| 18.04.2024 | 60 | 60 | 59 |
| 17.04.2024 | 61 | 63 | 60 |
| 16.04.2024 | 60 | 68 | 57 |
| 15.04.2024 | 57 | 58 | 56 |
| 14.04.2024 | 56 | 56 | 54 |
© Bayerisches Landesamt für Umwelt 2024