
- Start >
- Rivers >
- Waterlevel >
- Oberer Main - Elbe >
- Hallerndorf >
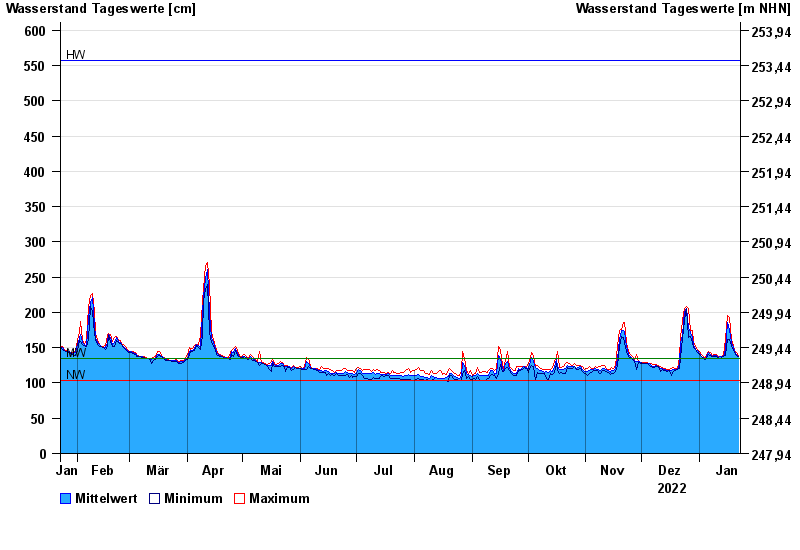
- Chart of year

Chart of year Hallerndorf / Aisch
Waterlevel from 23.01.2022 to 22.01.2023
| Date | Mean value [cm] | Maximum [cm] | Minimum [cm] |
|---|---|---|---|
| 22.01.2023 | 137 | 139 | 137 |
| 21.01.2023 | 141 | 143 | 139 |
| 20.01.2023 | 144 | 146 | 143 |
| 19.01.2023 | 150 | 153 | 146 |
| 18.01.2023 | 157 | 161 | 153 |
| 17.01.2023 | 176 | 193 | 161 |
| 16.01.2023 | 185 | 196 | 161 |
© Bayerisches Landesamt für Umwelt 2024