
- Start >
- Rivers >
- Waterlevel >
- Oberer Main - Elbe >
- Goldbergsee Ablauf >
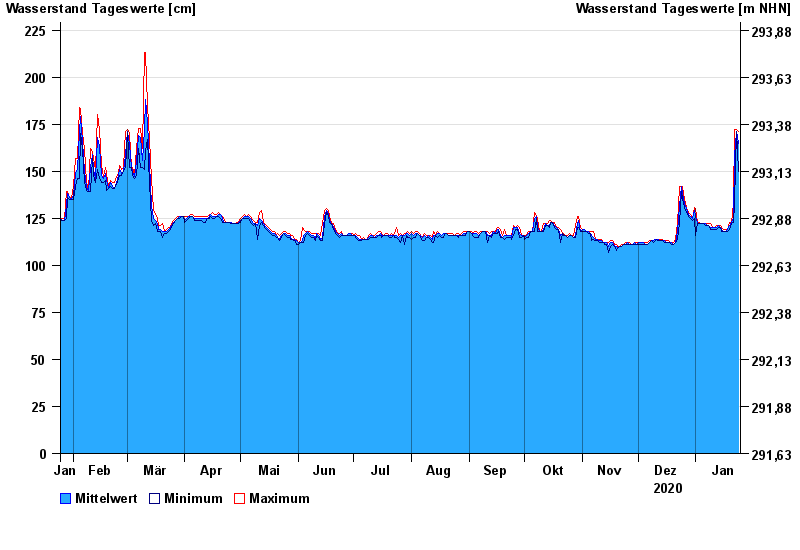
- Chart of year

Chart of year Goldbergsee Ablauf / Sulzbach
Waterlevel from 25.01.2020 to 24.01.2021
note
Beeinflussung des Abflusses aufgrund Hindernisse im Unterlauf.
| Date | Mean value [cm] | Maximum [cm] | Minimum [cm] |
|---|---|---|---|
| 24.01.2021 | 165 | 171 | 150 |
| 23.01.2021 | 171 | 172 | 171 |
| 22.01.2021 | 158 | 172 | 133 |
| 21.01.2021 | 125 | 133 | 123 |
| 20.01.2021 | 123 | 123 | 122 |
| 19.01.2021 | 121 | 123 | 119 |
| 18.01.2021 | 119 | 119 | 118 |
© Bayerisches Landesamt für Umwelt 2024