
- Start >
- Rivers >
- Waterlevel >
- Oberer Main - Elbe >
- Friedersreuth >
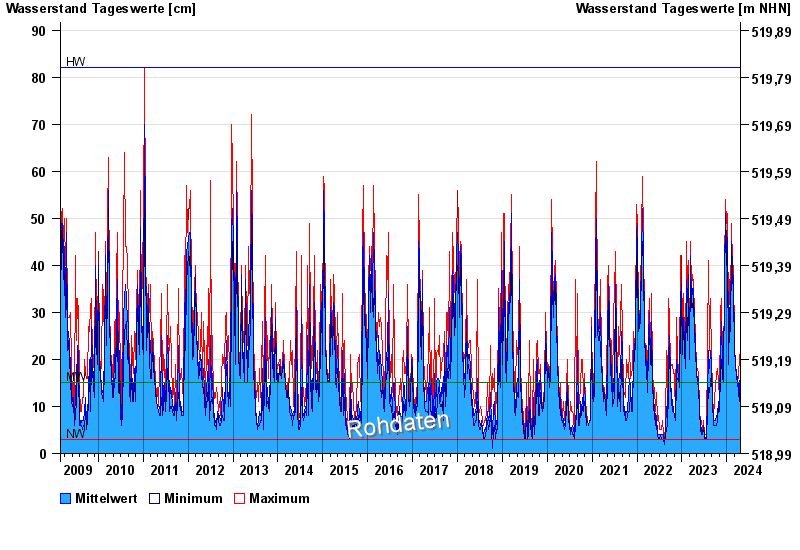
- Chart of total period

Chart of total period Friedersreuth / Schweinnaab
Waterlevel from 27.02.2009 to 20.04.2024
| Date | Mean value [cm] | Maximum [cm] | Minimum [cm] |
|---|---|---|---|
| 20.04.2024 | 18 | 18 | 18 |
| 19.04.2024 | 11 | 18 | 8 |
| 18.04.2024 | 8 | 9 | 7 |
| 17.04.2024 | 9 | 11 | 8 |
| 16.04.2024 | 8 | 12 | 7 |
| 15.04.2024 | 8 | 10 | 6 |
| 14.04.2024 | 9 | 10 | 9 |
© Bayerisches Landesamt für Umwelt 2024