
- Start >
- Rivers >
- Waterlevel >
- Oberer Main - Elbe >
- Friedersdorf >
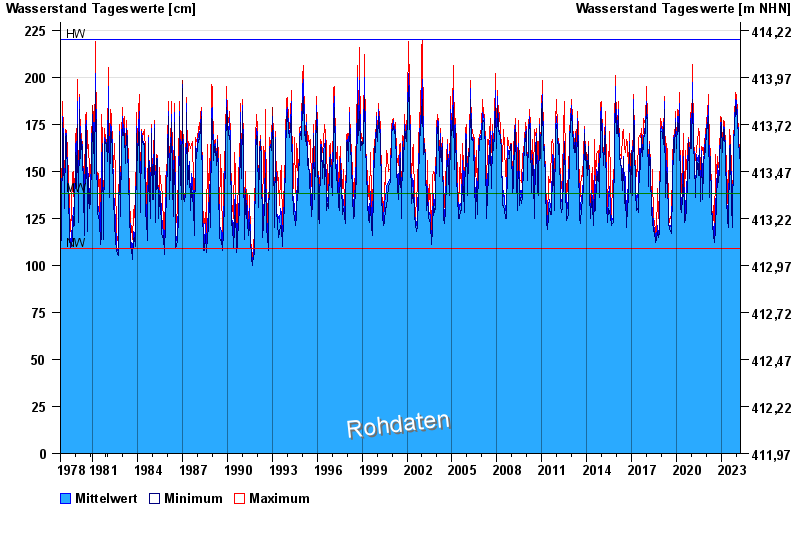
- Chart of total period

Chart of total period Friedersdorf / Buchbach
Waterlevel from 01.11.1978 to 18.04.2024
| Date | Mean value [cm] | Maximum [cm] | Minimum [cm] |
|---|---|---|---|
| 18.04.2024 | 145 | 146 | 145 |
| 17.04.2024 | 147 | 151 | 145 |
| 16.04.2024 | 146 | 158 | 140 |
| 15.04.2024 | 140 | 141 | 140 |
| 14.04.2024 | 141 | 142 | 140 |
| 13.04.2024 | 143 | 144 | 142 |
| 12.04.2024 | 145 | 146 | 144 |
© Bayerisches Landesamt für Umwelt 2024