
- Start >
- Rivers >
- Waterlevel >
- Oberer Main - Elbe >
- Förmitz Speicherzufluss >
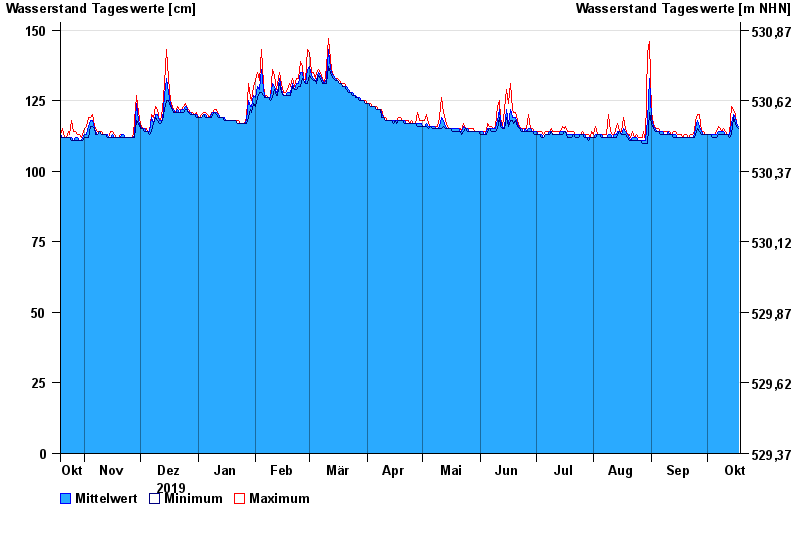
- Chart of year

Chart of year Förmitz Speicherzufluss / Förmitz
Waterlevel from 19.10.2019 to 18.10.2020
| Date | Mean value [cm] | Maximum [cm] | Minimum [cm] |
|---|---|---|---|
| 18.10.2020 | 116 | 116 | 115 |
| 17.10.2020 | 117 | 117 | 116 |
| 16.10.2020 | 119 | 120 | 117 |
| 15.10.2020 | 120 | 122 | 119 |
| 14.10.2020 | 117 | 123 | 113 |
| 13.10.2020 | 113 | 113 | 112 |
| 12.10.2020 | 113 | 113 | 113 |
© Bayerisches Landesamt für Umwelt 2024