
- Start >
- Rivers >
- Waterlevel >
- Oberer Main - Elbe >
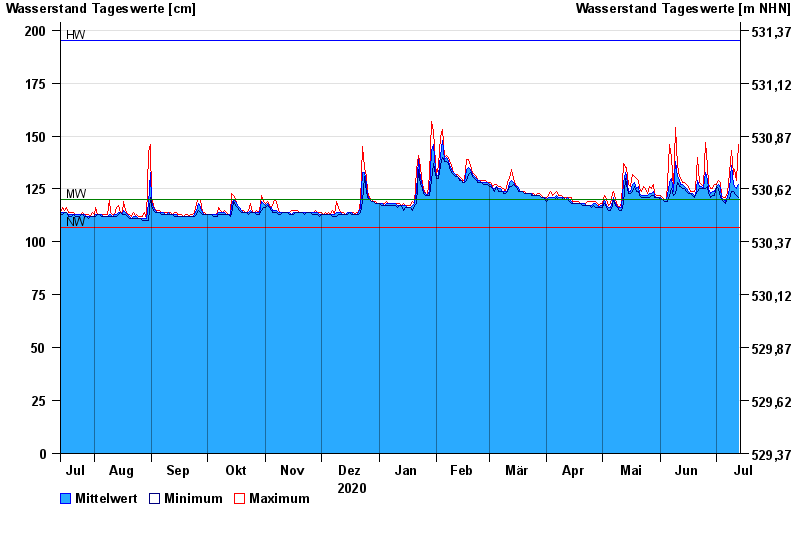
- Förmitz Speicherzufluss >
- Chart of year

Chart of year Förmitz Speicherzufluss / Förmitz
Waterlevel from 14.07.2020 to 13.07.2021
| Date | Mean value [cm] | Maximum [cm] | Minimum [cm] |
|---|---|---|---|
| 13.07.2021 | 127 | 146 | 121 |
| 12.07.2021 | 125 | 129 | 122 |
| 11.07.2021 | 126 | 134 | 123 |
| 10.07.2021 | 127 | 132 | 124 |
| 09.07.2021 | 136 | 143 | 124 |
| 08.07.2021 | 125 | 133 | 120 |
| 07.07.2021 | 121 | 123 | 120 |
© Bayerisches Landesamt für Umwelt 2024