
- Start >
- Rivers >
- Waterlevel >
- Oberer Main - Elbe >
- Fahrenbühl >
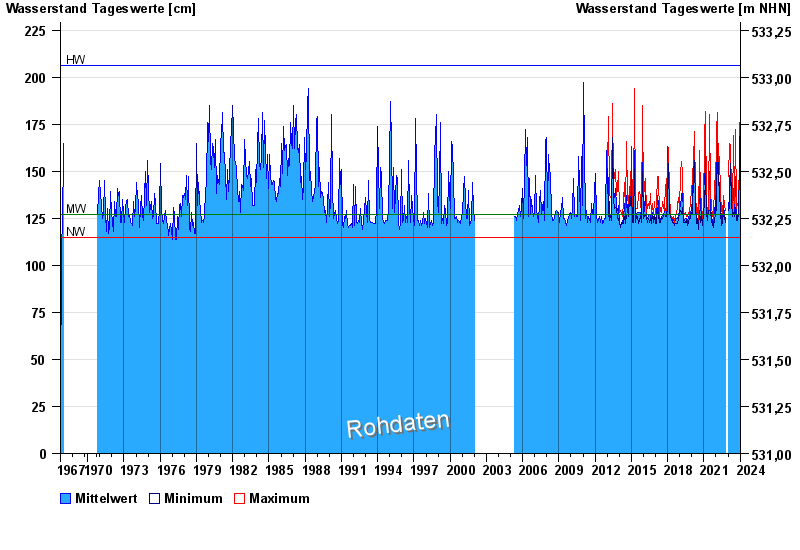
- Chart of total period

Chart of total period Fahrenbühl / Lamitz
Waterlevel from 02.10.1967 to 11.01.2024
note
Schlechte Netzanbindung
| Date | Mean value [cm] | Maximum [cm] | Minimum [cm] |
|---|---|---|---|
| 11.01.2024 | 149 | 150 | 147 |
| 10.01.2024 | 150 | 151 | 149 |
| 09.01.2024 | -- | -- | -- |
| 08.01.2024 | -- | -- | -- |
| 07.01.2024 | 158 | 160 | 157 |
| 06.01.2024 | 163 | 166 | 160 |
| 05.01.2024 | 172 | 180 | 166 |
© Bayerisches Landesamt für Umwelt 2024