
- Start >
- Rivers >
- Waterlevel >
- Oberer Main - Elbe >
- Erlabrück >
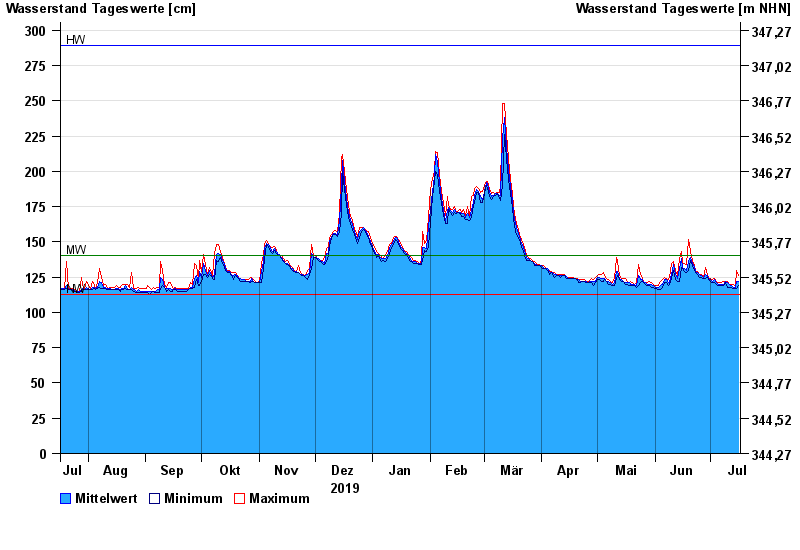
- Chart of year

Chart of year Erlabrück / Rodach
Waterlevel from 17.07.2019 to 16.07.2020
| Date | Mean value [cm] | Maximum [cm] | Minimum [cm] |
|---|---|---|---|
| 16.07.2020 | 122 | 126 | 119 |
| 15.07.2020 | 122 | 130 | 117 |
| 14.07.2020 | 118 | 119 | 117 |
| 13.07.2020 | 118 | 120 | 117 |
| 12.07.2020 | 119 | 120 | 118 |
| 11.07.2020 | 120 | 120 | 118 |
| 10.07.2020 | 121 | 122 | 118 |
© Bayerisches Landesamt für Umwelt 2024