
- Start >
- Rivers >
- Waterlevel >
- Oberer Main - Elbe >
- Erbendorf >
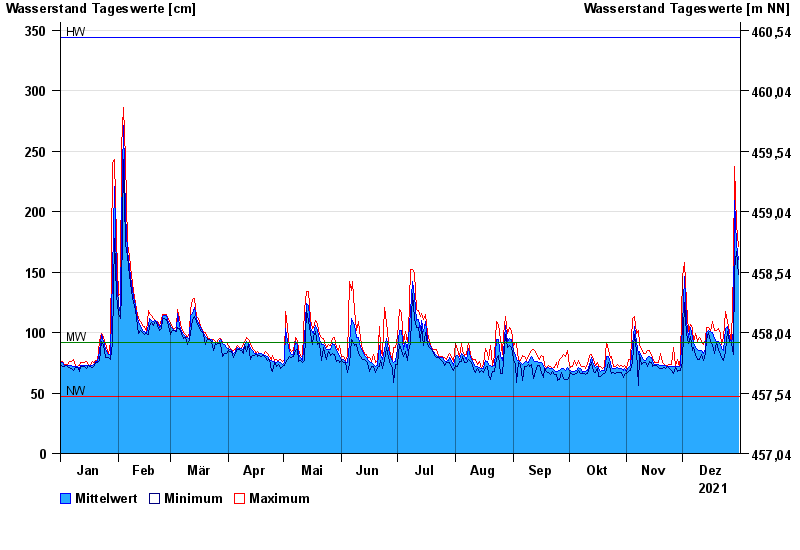
- Chart of year

Chart of year Erbendorf / Fichtelnaab
Waterlevel from 01.01.2021 to 31.12.2021
| Date | Mean value [cm] | Maximum [cm] | Minimum [cm] |
|---|---|---|---|
| 31.12.2021 | 160 | 171 | 148 |
| 30.12.2021 | 173 | 189 | 167 |
| 29.12.2021 | 209 | 237 | 152 |
| 28.12.2021 | 101 | 152 | 82 |
| 27.12.2021 | 92 | 93 | 91 |
| 26.12.2021 | 96 | 101 | 93 |
| 25.12.2021 | 105 | 109 | 101 |
© Bayerisches Landesamt für Umwelt 2024