
- Start >
- Rivers >
- Waterlevel >
- Oberer Main - Elbe >
- Coburg >
- Chart of year

Chart of year Coburg / Itz
Waterlevel from 02.08.2023 to 01.08.2024
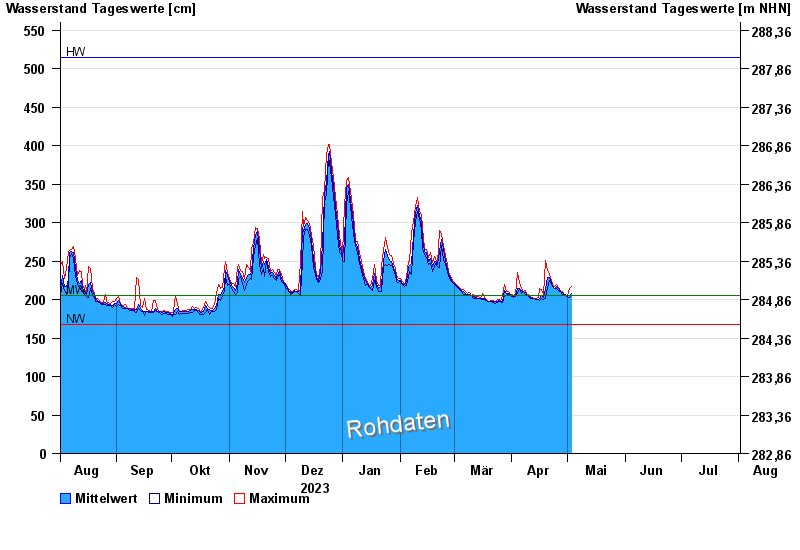
| Date | Mean value [cm] | Maximum [cm] | Minimum [cm] |
|---|---|---|---|
| 20.04.2024 | 238 | 238 | 237 |
| 19.04.2024 | 213 | 251 | 201 |
| 18.04.2024 | 203 | 206 | 200 |
| 17.04.2024 | 205 | 213 | 202 |
| 16.04.2024 | 202 | 214 | 199 |
| 15.04.2024 | 200 | 203 | 200 |
| 14.04.2024 | 200 | 201 | 200 |
© Bayerisches Landesamt für Umwelt 2024