
- Start >
- Rivers >
- Waterlevel >
- Oberer Main - Elbe >
- Coburg >
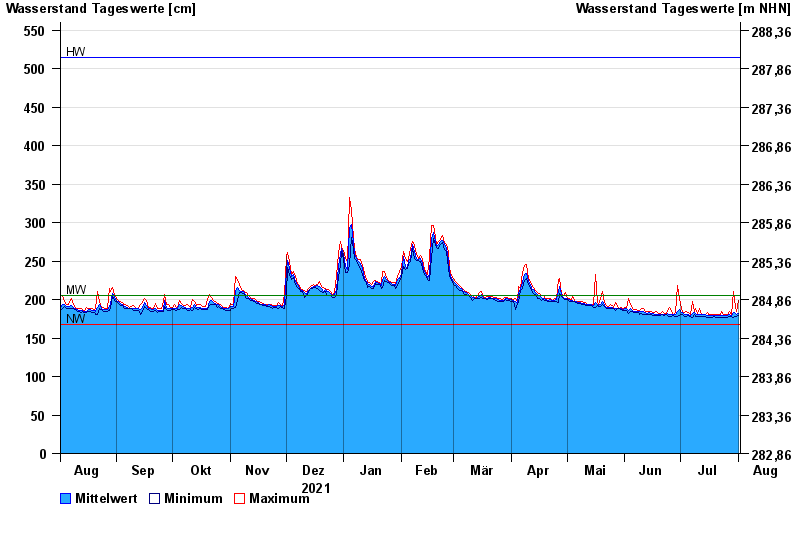
- Chart of year

Chart of year Coburg / Itz
Waterlevel from 02.08.2021 to 01.08.2022
| Date | Mean value [cm] | Maximum [cm] | Minimum [cm] |
|---|---|---|---|
| 01.08.2022 | 182 | 199 | 179 |
| 31.07.2022 | 181 | 185 | 178 |
| 30.07.2022 | 183 | 199 | 178 |
| 29.07.2022 | 183 | 211 | 177 |
| 28.07.2022 | 179 | 180 | 178 |
| 27.07.2022 | 180 | 184 | 178 |
| 26.07.2022 | 179 | 180 | 177 |
© Bayerisches Landesamt für Umwelt 2024