
- Start >
- Rivers >
- Waterlevel >
- Oberer Main - Elbe >
- Coburg >
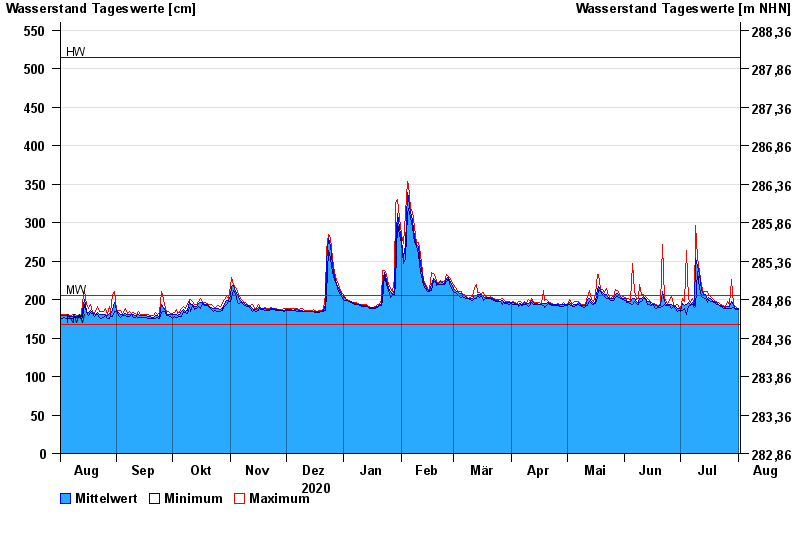
- Chart of year

Chart of year Coburg / Itz
Waterlevel from 02.08.2020 to 01.08.2021
| Date | Mean value [cm] | Maximum [cm] | Minimum [cm] |
|---|---|---|---|
| 01.08.2021 | 188 | 189 | 187 |
| 31.07.2021 | 189 | 190 | 187 |
| 30.07.2021 | 190 | 192 | 188 |
| 29.07.2021 | 192 | 194 | 190 |
| 28.07.2021 | 198 | 226 | 189 |
| 27.07.2021 | 191 | 193 | 189 |
| 26.07.2021 | 191 | 197 | 189 |
© Bayerisches Landesamt für Umwelt 2024