
- Start >
- Rivers >
- Waterlevel >
- Oberer Main - Elbe >
- Coburg >
- Chart of year

Chart of year Coburg / Itz
Waterlevel from 01.01.2020 to 31.12.2020
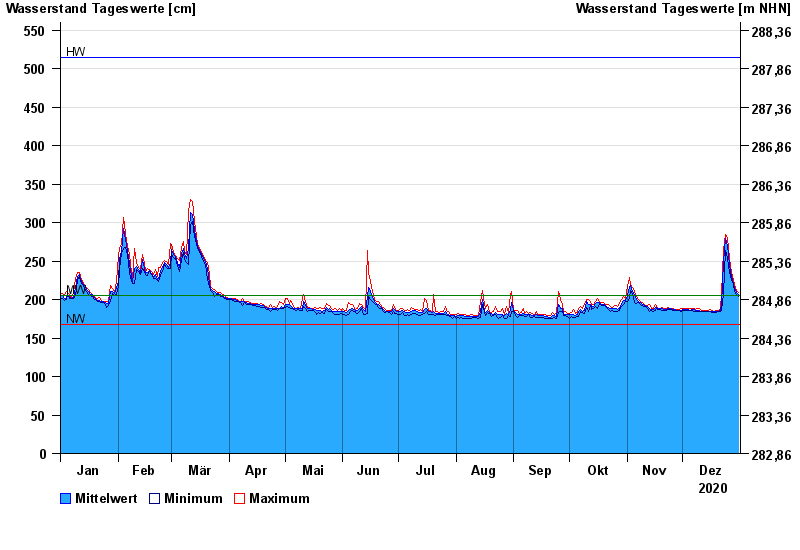
| Date | Mean value [cm] | Maximum [cm] | Minimum [cm] |
|---|---|---|---|
| 31.12.2020 | 207 | 209 | 204 |
| 30.12.2020 | 209 | 212 | 206 |
| 29.12.2020 | 215 | 220 | 211 |
| 28.12.2020 | 221 | 226 | 220 |
| 27.12.2020 | 230 | 235 | 225 |
| 26.12.2020 | 244 | 254 | 235 |
| 25.12.2020 | 270 | 281 | 254 |
© Bayerisches Landesamt für Umwelt 2024