
- Start >
- Rivers >
- Waterlevel >
- Oberer Main - Elbe >
- Coburg >
- Chart of year

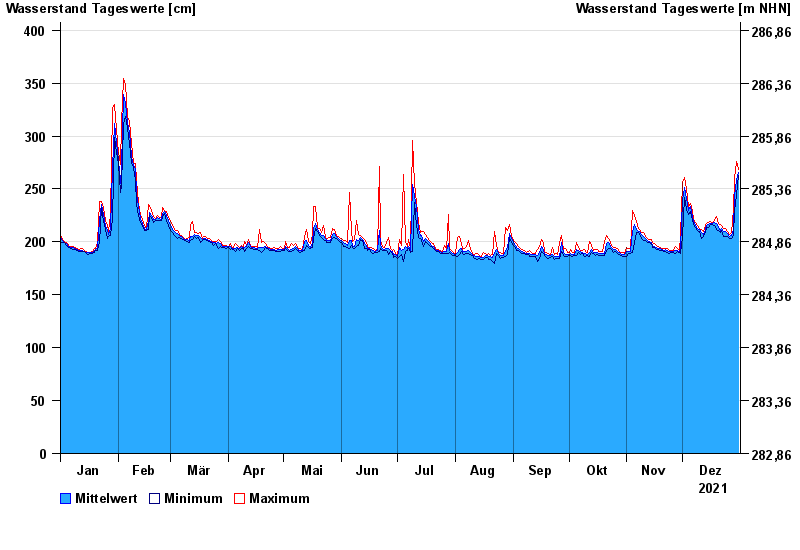
Chart of year Coburg / Itz
Waterlevel from 01.01.2021 to 31.12.2021
| Date | Mean value [cm] | Maximum [cm] | Minimum [cm] |
|---|---|---|---|
| 31.12.2021 | 266 | 268 | 263 |
| 30.12.2021 | 258 | 276 | 244 |
| 29.12.2021 | 243 | 260 | 230 |
| 28.12.2021 | 212 | 231 | 206 |
| 27.12.2021 | 206 | 209 | 203 |
| 26.12.2021 | 205 | 207 | 203 |
| 25.12.2021 | 208 | 210 | 205 |
© Bayerisches Landesamt für Umwelt 2024