
- Start >
- Rivers >
- Waterlevel >
- Oberer Main - Elbe >
- Bayreuth >
- Chart of year

Chart of year Bayreuth / Roter Main
Waterlevel from 19.05.2022 to 18.05.2023
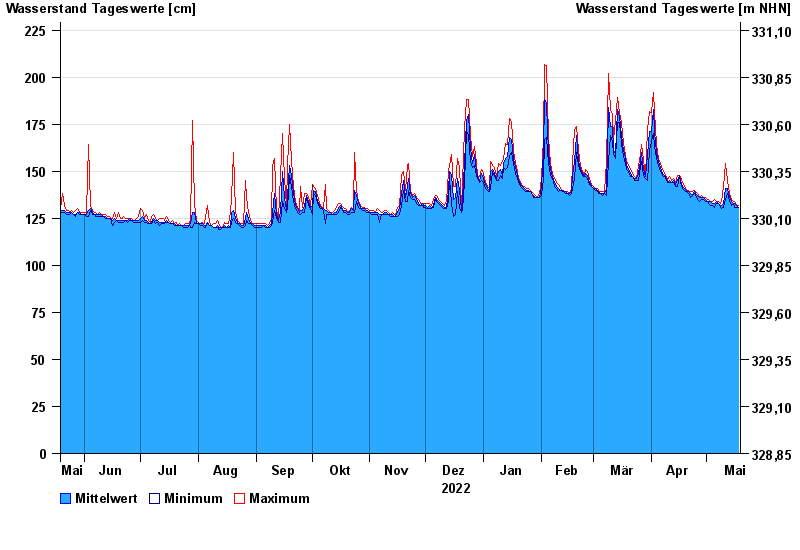
| Date | Mean value [cm] | Maximum [cm] | Minimum [cm] |
|---|---|---|---|
| 18.05.2023 | 131 | 132 | 131 |
| 17.05.2023 | 132 | 132 | 131 |
| 16.05.2023 | 133 | 134 | 131 |
| 15.05.2023 | 133 | 134 | 133 |
| 14.05.2023 | 134 | 135 | 132 |
| 13.05.2023 | 136 | 138 | 134 |
| 12.05.2023 | 141 | 145 | 138 |
© Bayerisches Landesamt für Umwelt 2024