
- Start >
- Rivers >
- Waterlevel >
- Oberer Main - Elbe >
- Bärenthal >
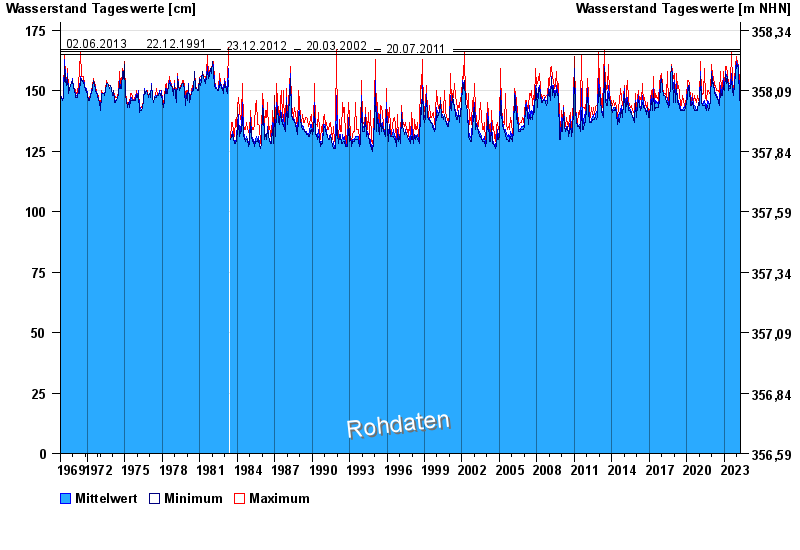
- Chart of total period

Chart of total period Bärenthal / Trubach
Waterlevel from 01.11.1969 to 25.04.2024
note
Absinken des Wasserstandes wegen Entfernung von Auflandungen.
- 02.06.2013 Wasserstand: 167 cm
- 22.12.1991 Wasserstand: 167 cm
- 23.12.2012 Wasserstand: 166 cm
- 20.03.2002 Wasserstand: 166 cm
- 20.07.2011 Wasserstand: 165 cm
| Date | Mean value [cm] | Maximum [cm] | Minimum [cm] |
|---|---|---|---|
| 25.04.2024 | 147 | 148 | 147 |
| 24.04.2024 | 147 | 148 | 146 |
| 23.04.2024 | 147 | 149 | 146 |
| 22.04.2024 | 148 | 149 | 147 |
| 21.04.2024 | 148 | 149 | 146 |
| 20.04.2024 | 147 | 149 | 146 |
| 19.04.2024 | 147 | 151 | 145 |
© Bayerisches Landesamt für Umwelt 2024