
- Start >
- Rivers >
- Waterlevel >
- Oberer Main - Elbe >
- Aeschach >
- Chart of total period

Chart of total period Aeschach / Oberreitnauer Ach
Waterlevel from 12.09.2012 to 25.04.2024
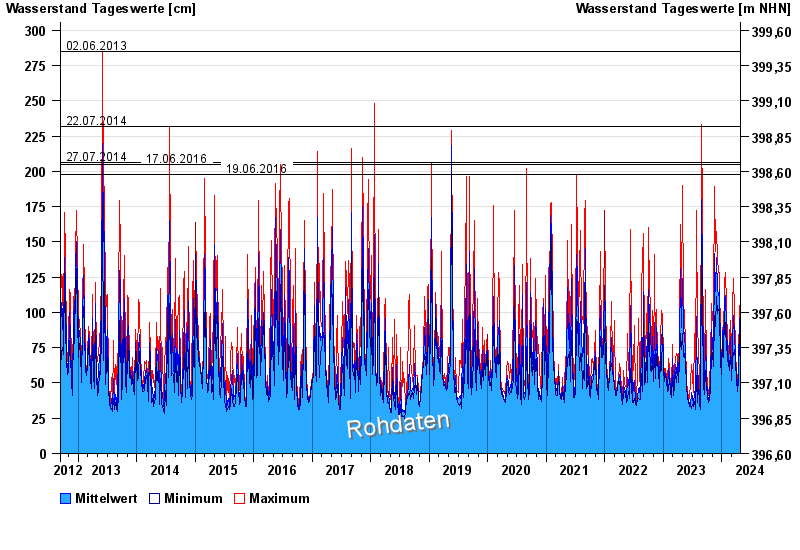
- 02.06.2013 Wasserstand: 285 cm
- 22.07.2014 Wasserstand: 232 cm
- 27.07.2014 Wasserstand: 206 cm
- 17.06.2016 Wasserstand: 205 cm
- 19.06.2016 Wasserstand: 198 cm
| Date | Mean value [cm] | Maximum [cm] | Minimum [cm] |
|---|---|---|---|
| 25.04.2024 | 57 | 58 | 56 |
| 24.04.2024 | 60 | 62 | 58 |
| 23.04.2024 | 66 | 71 | 62 |
| 22.04.2024 | 78 | 85 | 72 |
| 21.04.2024 | 85 | 92 | 81 |
| 20.04.2024 | 93 | 105 | 83 |
| 19.04.2024 | 81 | 100 | 74 |
© Bayerisches Landesamt für Umwelt 2024