
- Start >
- Rivers >
- Waterlevel >
- Bayern >
- Würzburg >
- Chart of total period

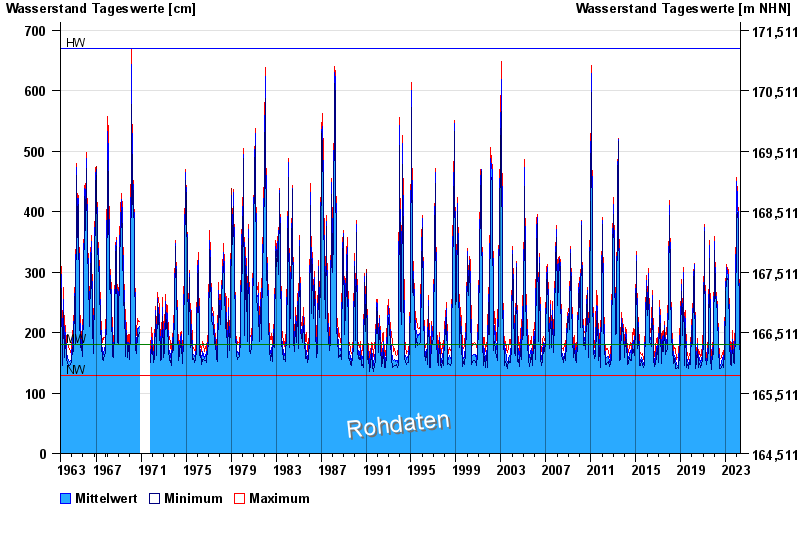
Chart of total period Würzburg / Main
Waterlevel from 28.10.1963 to 25.04.2024
| Date | Mean value [cm] | Maximum [cm] | Minimum [cm] |
|---|---|---|---|
| 25.04.2024 | 183 | 186 | 178 |
| 24.04.2024 | 183 | 188 | 179 |
| 23.04.2024 | 194 | 198 | 186 |
| 22.04.2024 | 190 | 198 | 185 |
| 21.04.2024 | 180 | 187 | 168 |
| 20.04.2024 | 160 | 168 | 86 |
| 19.04.2024 | 157 | 160 | 153 |
© Bayerisches Landesamt für Umwelt 2024