
- Start >
- Rivers >
- Waterlevel >
- Bayern >
- Würzburg >
- Chart of total period

Chart of total period Würzburg / Main
Waterlevel from 28.10.1963 to 20.04.2024
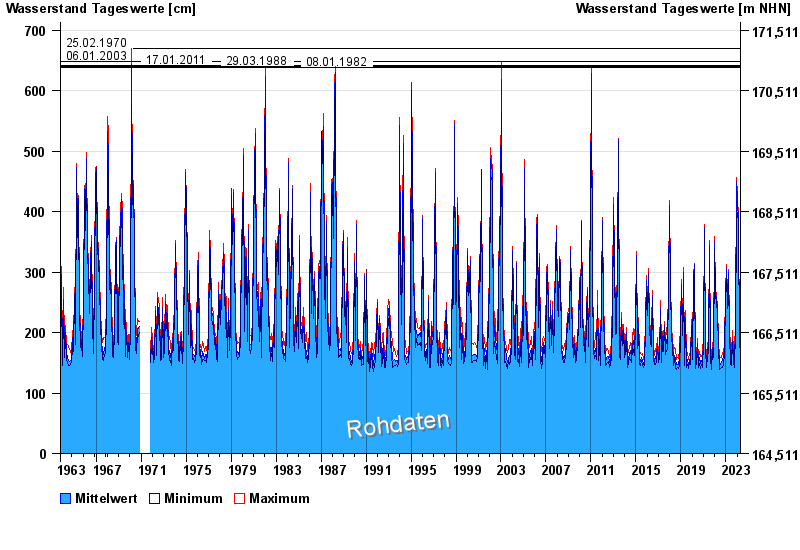
- 25.02.1970 Wasserstand: 669 cm
- 06.01.2003 Wasserstand: 648 cm
- 17.01.2011 Wasserstand: 642 cm
- 29.03.1988 Wasserstand: 640 cm
- 08.01.1982 Wasserstand: 639 cm
| Date | Mean value [cm] | Maximum [cm] | Minimum [cm] |
|---|---|---|---|
| 20.04.2024 | 160 | 161 | 159 |
| 19.04.2024 | 157 | 160 | 153 |
| 18.04.2024 | 157 | 160 | 153 |
| 17.04.2024 | 155 | 160 | 151 |
| 16.04.2024 | 154 | 157 | 150 |
| 15.04.2024 | 152 | 158 | 147 |
| 14.04.2024 | 152 | 158 | 148 |
© Bayerisches Landesamt für Umwelt 2024