
- Start >
- Rivers >
- Waterlevel >
- Bayern >
- Wörth >
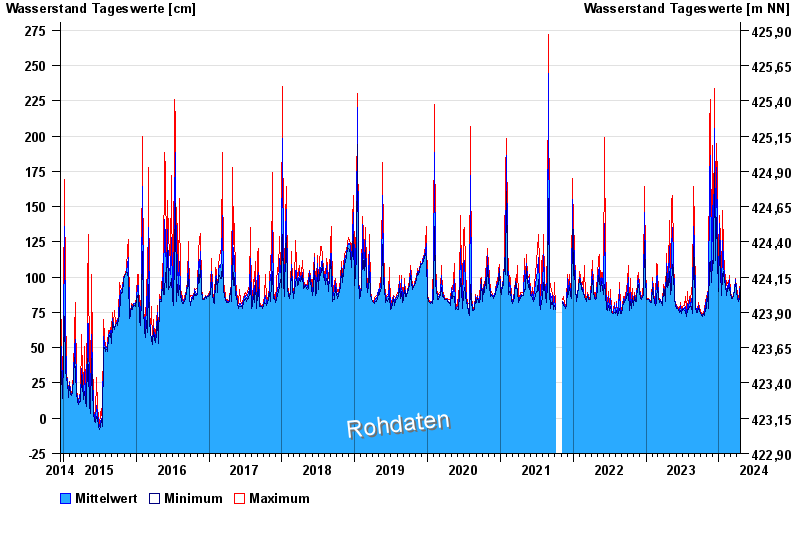
- Chart of total period

Chart of total period Wörth / Isen
Waterlevel from 17.12.2014 to 18.04.2024
| Date | Mean value [cm] | Maximum [cm] | Minimum [cm] |
|---|---|---|---|
| 18.04.2024 | 97 | 97 | 97 |
| 17.04.2024 | 93 | 97 | 84 |
| 16.04.2024 | 87 | 90 | 84 |
| 15.04.2024 | 85 | 90 | 82 |
| 14.04.2024 | 82 | 82 | 82 |
| 13.04.2024 | 82 | 83 | 82 |
| 12.04.2024 | 82 | 83 | 82 |
© Bayerisches Landesamt für Umwelt 2024