
- Start >
- Rivers >
- Waterlevel >
- Bayern >
- Untersteinach >
- Chart of total period

Chart of total period Untersteinach / Warme Steinach
Waterlevel from 01.11.1963 to 16.04.2024
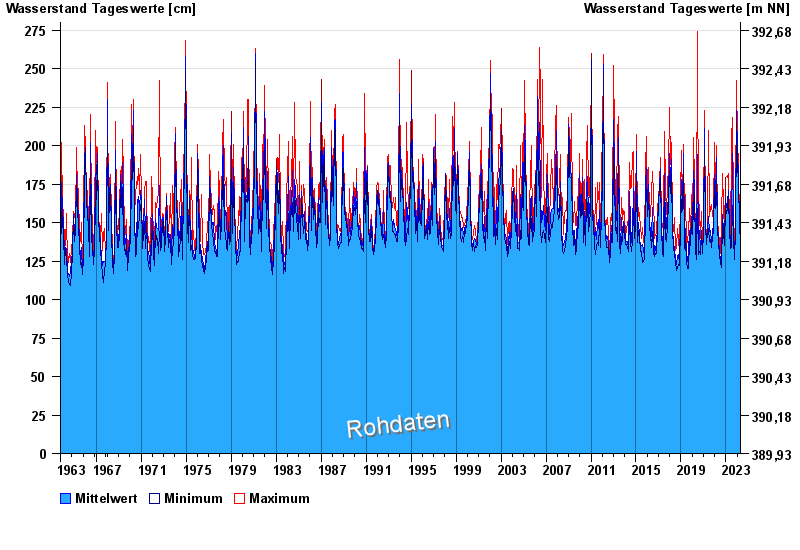
| Date | Mean value [cm] | Maximum [cm] | Minimum [cm] |
|---|---|---|---|
| 16.04.2024 | 132 | 133 | 131 |
| 15.04.2024 | 132 | 133 | 131 |
| 14.04.2024 | 132 | 134 | 131 |
| 13.04.2024 | 132 | 135 | 132 |
| 12.04.2024 | 133 | 133 | 128 |
| 11.04.2024 | 133 | 133 | 133 |
| 10.04.2024 | 134 | 134 | 133 |
© Bayerisches Landesamt für Umwelt 2024