
- Start >
- Rivers >
- Waterlevel >
- Bayern >
- Untersteinach >
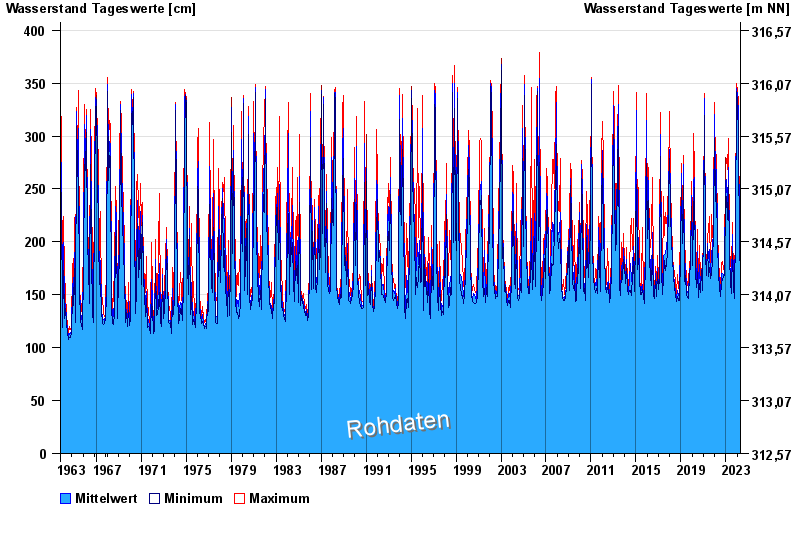
- Chart of total period

Chart of total period Untersteinach / Schorgast
Waterlevel from 28.10.1963 to 19.04.2024
 Für diesen Pegel sind keine Hochwassermarken hinterlegt.
note
Schlechte Netzanbindung
| Date | Mean value [cm] | Maximum [cm] | Minimum [cm] |
|---|---|---|---|
| 19.04.2024 | 169 | 188 | 165 |
| 18.04.2024 | 167 | 167 | 166 |
| 17.04.2024 | 168 | 170 | 167 |
| 16.04.2024 | 167 | 170 | 166 |
| 15.04.2024 | 165 | 166 | 165 |
| 14.04.2024 | 166 | 166 | 165 |
| 13.04.2024 | 166 | 167 | 166 |
© Bayerisches Landesamt für Umwelt 2024