
- Start >
- Rivers >
- Waterlevel >
- Bayern >
- Unterbruck >
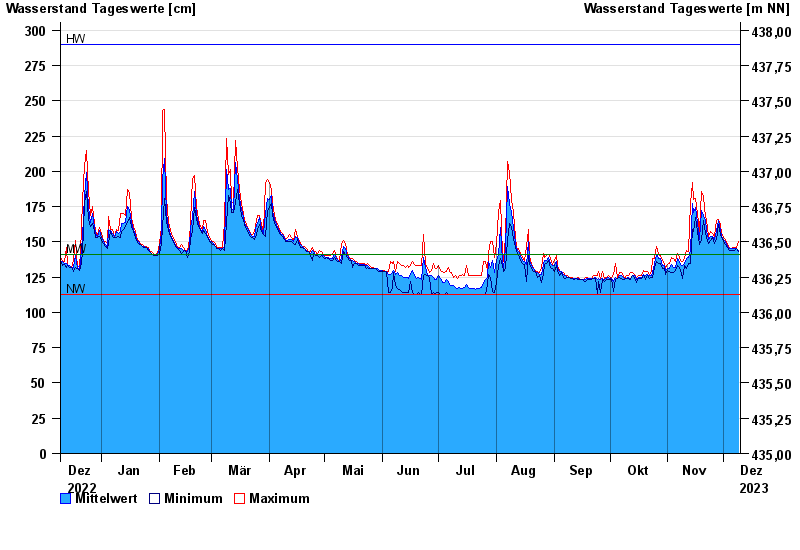
- Chart of year

Chart of year Unterbruck / Haidenaab
Waterlevel from 10.12.2022 to 09.12.2023
| Date | Mean value [cm] | Maximum [cm] | Minimum [cm] |
|---|---|---|---|
| 09.12.2023 | 144 | 150 | 143 |
| 08.12.2023 | 145 | 146 | 145 |
| 07.12.2023 | 145 | 146 | 144 |
| 06.12.2023 | 145 | 146 | 144 |
| 05.12.2023 | 145 | 145 | 144 |
| 04.12.2023 | 145 | 146 | 144 |
| 03.12.2023 | 147 | 148 | 146 |
© Bayerisches Landesamt für Umwelt 2024