
- Start >
- Rivers >
- Waterlevel >
- Bayern >
- Unterbruck >
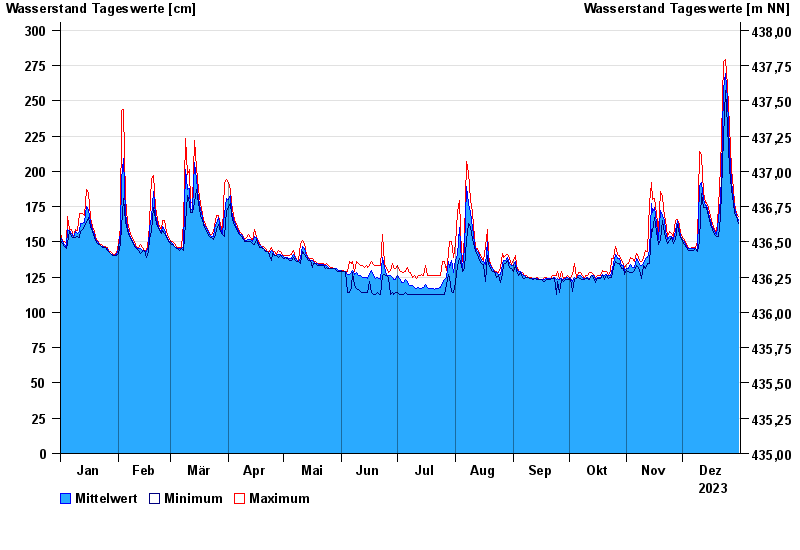
- Chart of year

Chart of year Unterbruck / Haidenaab
Waterlevel from 01.01.2023 to 31.12.2023
| Date | Mean value [cm] | Maximum [cm] | Minimum [cm] |
|---|---|---|---|
| 31.12.2023 | 165 | 168 | 163 |
| 30.12.2023 | 169 | 170 | 168 |
| 29.12.2023 | 174 | 177 | 170 |
| 28.12.2023 | 181 | 187 | 177 |
| 27.12.2023 | 193 | 202 | 187 |
| 26.12.2023 | 215 | 232 | 202 |
| 25.12.2023 | 251 | 261 | 232 |
© Bayerisches Landesamt für Umwelt 2024