
- Start >
- Rivers >
- Waterlevel >
- Bayern >
- Türkheim >
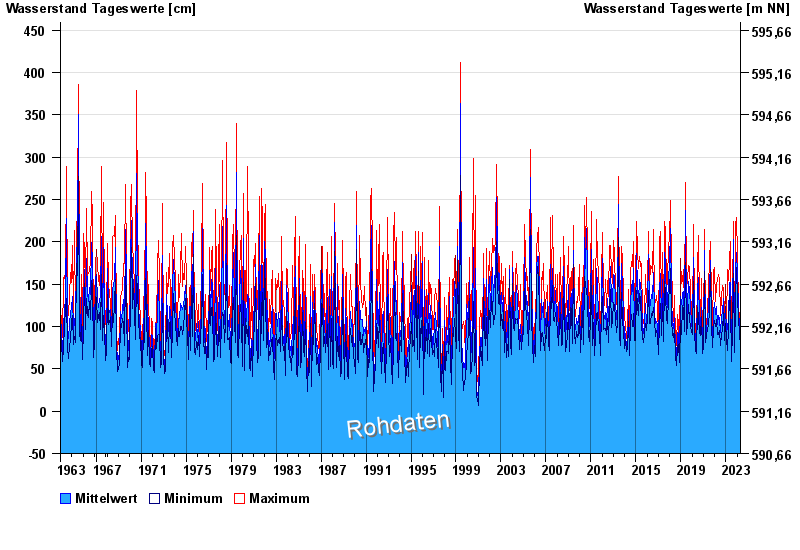
- Chart of total period

Chart of total period Türkheim / Wertach
Waterlevel from 01.11.1963 to 18.04.2024
note
Beeinflussung durch Kraftwerksbetrieb
| Date | Mean value [cm] | Maximum [cm] | Minimum [cm] |
|---|---|---|---|
| 18.04.2024 | 82 | 84 | 82 |
| 17.04.2024 | 72 | 92 | 60 |
| 16.04.2024 | 69 | 76 | 65 |
| 15.04.2024 | 69 | 79 | 62 |
| 14.04.2024 | 66 | 68 | 65 |
| 13.04.2024 | 66 | 71 | 63 |
| 12.04.2024 | 67 | 70 | 65 |
© Bayerisches Landesamt für Umwelt 2024