
- Start >
- Rivers >
- Waterlevel >
- Bayern >
- Schönbrunn >
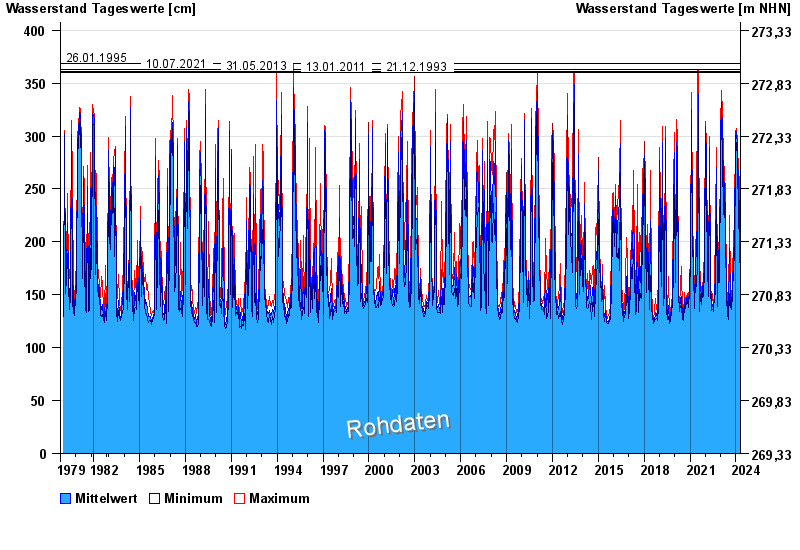
- Chart of total period

Chart of total period Schönbrunn / Rauhe Ebrach
Waterlevel from 01.11.1979 to 19.04.2024
note
Beeinflussung des Abflusses aufgrund Hindernisse im Unterlauf
- 26.01.1995 Wasserstand: 369 cm
- 10.07.2021 Wasserstand: 363 cm
- 31.05.2013 Wasserstand: 361 cm
- 13.01.2011 Wasserstand: 360 cm
- 21.12.1993 Wasserstand: 360 cm
| Date | Mean value [cm] | Maximum [cm] | Minimum [cm] |
|---|---|---|---|
| 19.04.2024 | 147 | 147 | 146 |
| 18.04.2024 | 147 | 150 | 144 |
| 17.04.2024 | 150 | 152 | 147 |
| 16.04.2024 | 147 | 151 | 146 |
| 15.04.2024 | 145 | 147 | 144 |
| 14.04.2024 | 145 | 146 | 144 |
| 13.04.2024 | 147 | 147 | 145 |
© Bayerisches Landesamt für Umwelt 2024