
- Start >
- Rivers >
- Waterlevel >
- Bayern >
- Schmerold >
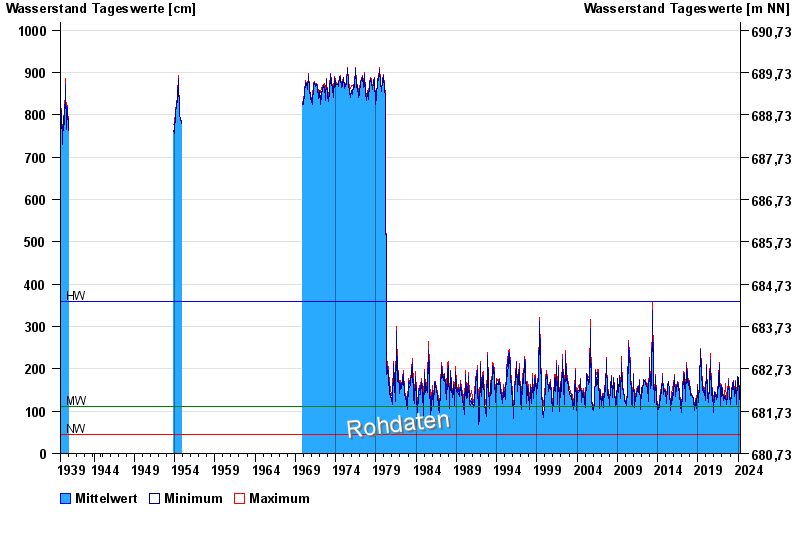
- Chart of total period

Chart of total period Schmerold / Mangfall
Waterlevel from 30.10.1939 to 19.04.2024
| Date | Mean value [cm] | Maximum [cm] | Minimum [cm] |
|---|---|---|---|
| 19.04.2024 | 110 | 111 | 109 |
| 18.04.2024 | 109 | 111 | 108 |
| 17.04.2024 | 105 | 112 | 100 |
| 16.04.2024 | 102 | 103 | 100 |
| 15.04.2024 | 102 | 111 | 94 |
| 14.04.2024 | 104 | 109 | 92 |
| 13.04.2024 | 106 | 107 | 104 |
© Bayerisches Landesamt für Umwelt 2024