
- Start >
- Rivers >
- Waterlevel >
- Bayern >
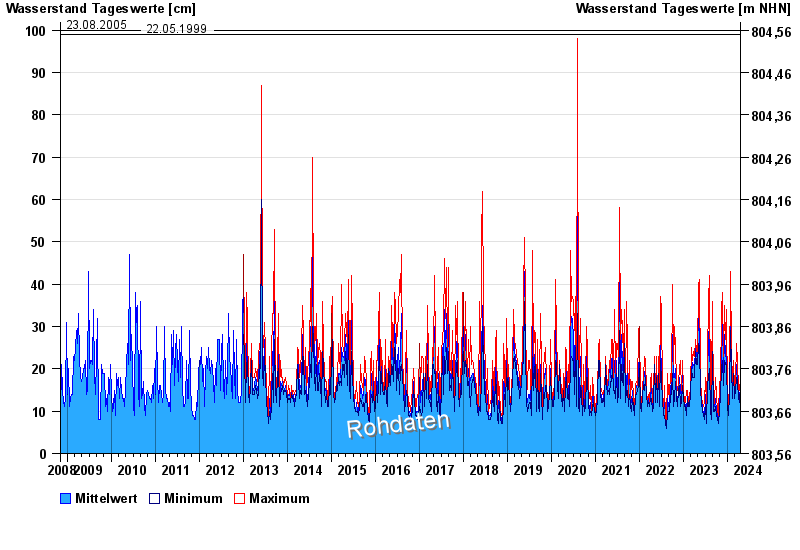
- Sachenbach >
- Chart of total period

Chart of total period Sachenbach / Sachenbach
Waterlevel from 05.11.2008 to 19.04.2024
- 05.02.1978 Wasserstand: 140 cm
- 27.11.1977 Wasserstand: 125 cm
- 11.07.2005 Wasserstand: 109 cm
- 23.08.2005 Wasserstand: 100 cm
- 22.05.1999 Wasserstand: 99 cm
| Date | Mean value [cm] | Maximum [cm] | Minimum [cm] |
|---|---|---|---|
| 19.04.2024 | 16 | 17 | 16 |
| 18.04.2024 | 15 | 18 | 14 |
| 17.04.2024 | 13 | 16 | 11 |
| 16.04.2024 | 11 | 12 | 11 |
| 15.04.2024 | 11 | 12 | 11 |
| 14.04.2024 | 11 | 12 | 11 |
| 13.04.2024 | 12 | 12 | 11 |
© Bayerisches Landesamt für Umwelt 2024