
- Start >
- Rivers >
- Waterlevel >
- Bayern >
- Pfelling >
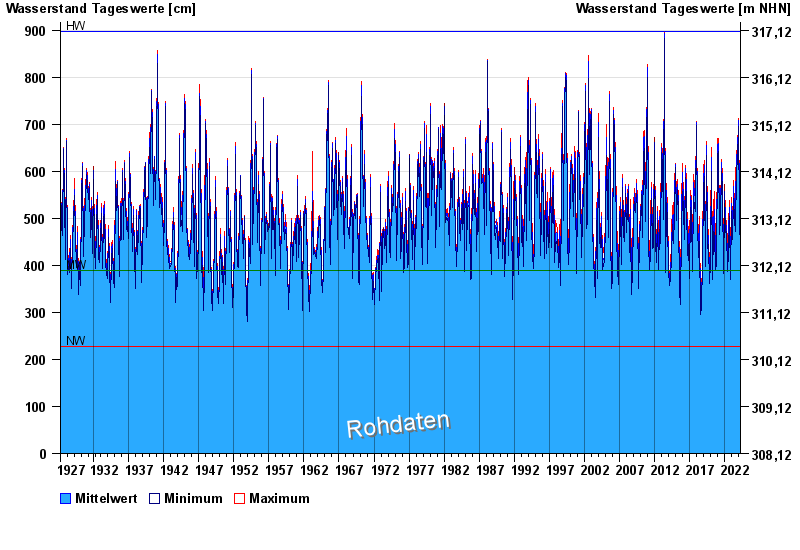
- Chart of total period

Chart of total period Pfelling / Donau
Waterlevel from 04.04.1927 to 19.04.2024
| Date | Mean value [cm] | Maximum [cm] | Minimum [cm] |
|---|---|---|---|
| 19.04.2024 | 426 | 429 | 423 |
| 18.04.2024 | 414 | 426 | 408 |
| 17.04.2024 | 408 | 415 | 398 |
| 16.04.2024 | 394 | 403 | 383 |
| 15.04.2024 | 384 | 387 | 380 |
| 14.04.2024 | 383 | 389 | 377 |
| 13.04.2024 | 384 | 386 | 381 |
© Bayerisches Landesamt für Umwelt 2024