
- Start >
- Rivers >
- Waterlevel >
- Bayern >
- Pfarrweisach >
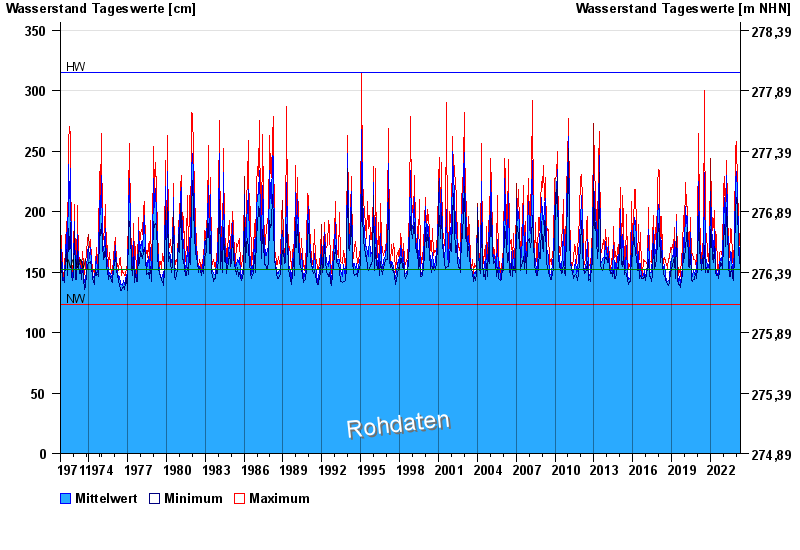
- Chart of total period

Chart of total period Pfarrweisach / Weisach
Waterlevel from 01.11.1971 to 24.04.2024
| Date | Mean value [cm] | Maximum [cm] | Minimum [cm] |
|---|---|---|---|
| 24.04.2024 | 154 | 154 | 154 |
| 23.04.2024 | 155 | 156 | 154 |
| 22.04.2024 | 159 | 164 | 157 |
| 21.04.2024 | 165 | 171 | 156 |
| 20.04.2024 | 159 | 165 | 156 |
| 19.04.2024 | 155 | 163 | 152 |
| 18.04.2024 | 153 | 154 | 152 |
© Bayerisches Landesamt für Umwelt 2024