
- Start >
- Rivers >
- Waterlevel >
- Bayern >
- Percha >
- Chart of total period

Chart of total period Percha / Lüßbach
Waterlevel from 01.11.1978 to 25.04.2024
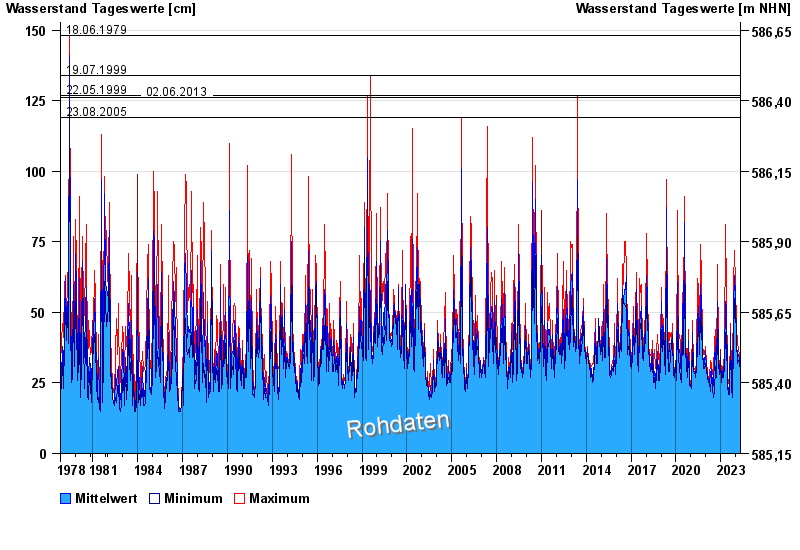
- 18.06.1979 Wasserstand: 148 cm
- 19.07.1999 Wasserstand: 134 cm
- 22.05.1999 Wasserstand: 127 cm
- 02.06.2013 Wasserstand: 126 cm
- 23.08.2005 Wasserstand: 119 cm
| Date | Mean value [cm] | Maximum [cm] | Minimum [cm] |
|---|---|---|---|
| 25.04.2024 | 30 | 30 | 29 |
| 24.04.2024 | 30 | 31 | 29 |
| 23.04.2024 | 30 | 31 | 29 |
| 22.04.2024 | 31 | 32 | 29 |
| 21.04.2024 | 30 | 32 | 28 |
| 20.04.2024 | 30 | 33 | 29 |
| 19.04.2024 | 29 | 30 | 28 |
© Bayerisches Landesamt für Umwelt 2024