
- Start >
- Rivers >
- Waterlevel >
- Bayern >
- Parsberg >
- Chart of total period

Chart of total period Parsberg / Schwarze Laber
Waterlevel from 01.11.1969 to 25.04.2024
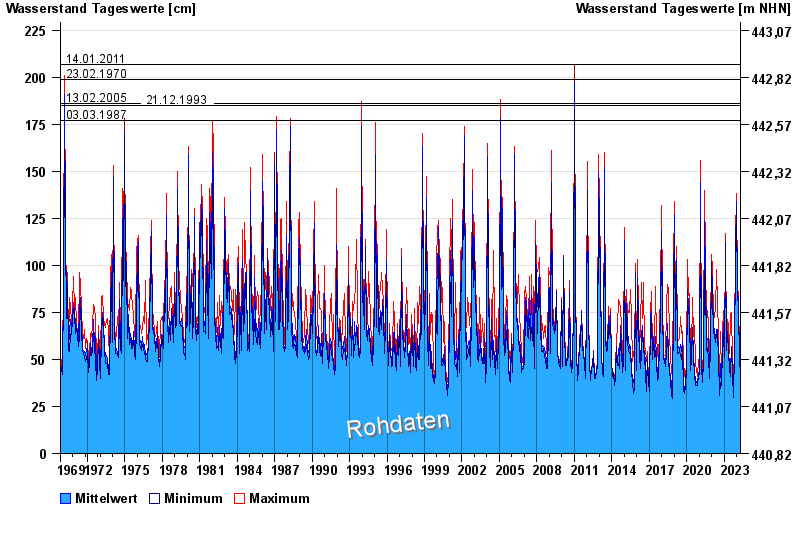
- 14.01.2011 Wasserstand: 207 cm
- 23.02.1970 Wasserstand: 199 cm
- 13.02.2005 Wasserstand: 186 cm
- 21.12.1993 Wasserstand: 185 cm
- 03.03.1987 Wasserstand: 177 cm
| Date | Mean value [cm] | Maximum [cm] | Minimum [cm] |
|---|---|---|---|
| 25.04.2024 | 58 | 63 | 56 |
| 24.04.2024 | 60 | 65 | 57 |
| 23.04.2024 | 62 | 63 | 59 |
| 22.04.2024 | 63 | 65 | 62 |
| 21.04.2024 | 59 | 62 | 58 |
| 20.04.2024 | 59 | 65 | 55 |
| 19.04.2024 | 49 | 55 | 46 |
© Bayerisches Landesamt für Umwelt 2024