
- Start >
- Rivers >
- Waterlevel >
- Bayern >
- Ösbühl >
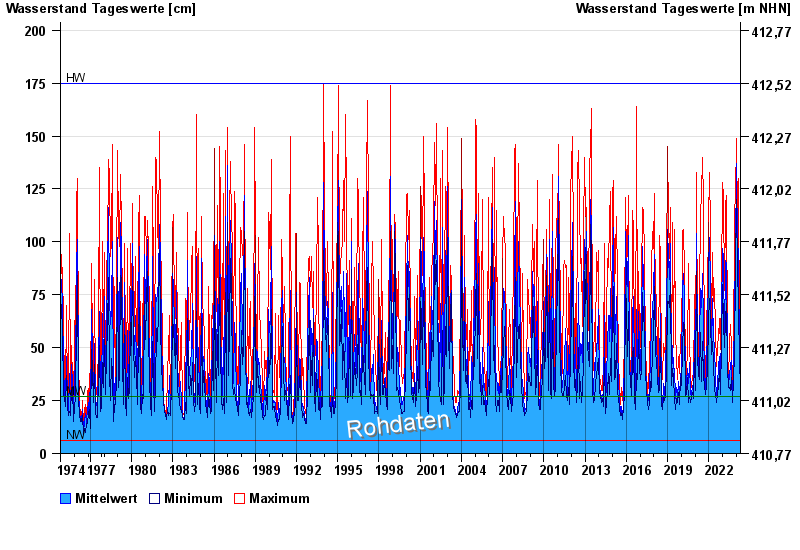
- Chart of total period

Chart of total period Ösbühl / Danglesbach
Waterlevel from 01.11.1974 to 18.04.2024
| Date | Mean value [cm] | Maximum [cm] | Minimum [cm] |
|---|---|---|---|
| 18.04.2024 | 65 | 80 | 46 |
| 17.04.2024 | 39 | 45 | 36 |
| 16.04.2024 | 36 | 42 | 32 |
| 15.04.2024 | 33 | 35 | 31 |
| 14.04.2024 | 31 | 33 | 30 |
| 13.04.2024 | 31 | 32 | 31 |
| 12.04.2024 | 31 | 33 | 31 |
© Bayerisches Landesamt für Umwelt 2024