
- Start >
- Rivers >
- Waterlevel >
- Bayern >
- Oberndorf >
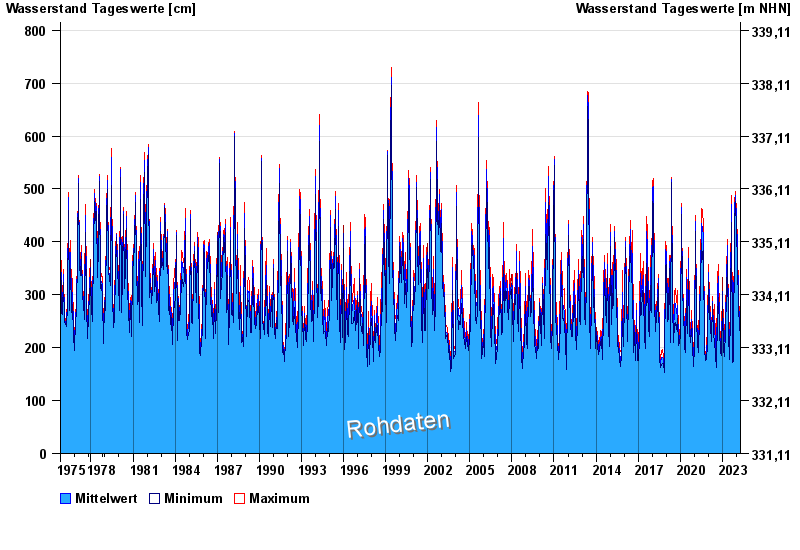
- Chart of total period

Chart of total period Oberndorf / Donau
Waterlevel from 01.11.1975 to 16.04.2024
| Date | Mean value [cm] | Maximum [cm] | Minimum [cm] |
|---|---|---|---|
| 16.04.2024 | 232 | 238 | 225 |
| 15.04.2024 | 222 | 227 | 216 |
| 14.04.2024 | 220 | 224 | 213 |
| 13.04.2024 | 219 | 226 | 215 |
| 12.04.2024 | 218 | 220 | 214 |
| 11.04.2024 | 221 | 226 | 216 |
| 10.04.2024 | 223 | 227 | 218 |
© Bayerisches Landesamt für Umwelt 2024