
- Start >
- Rivers >
- Waterlevel >
- Bayern >
- Obernach >
- Chart of total period

Chart of total period Obernach / Ach
Waterlevel from 01.11.1963 to 19.04.2024
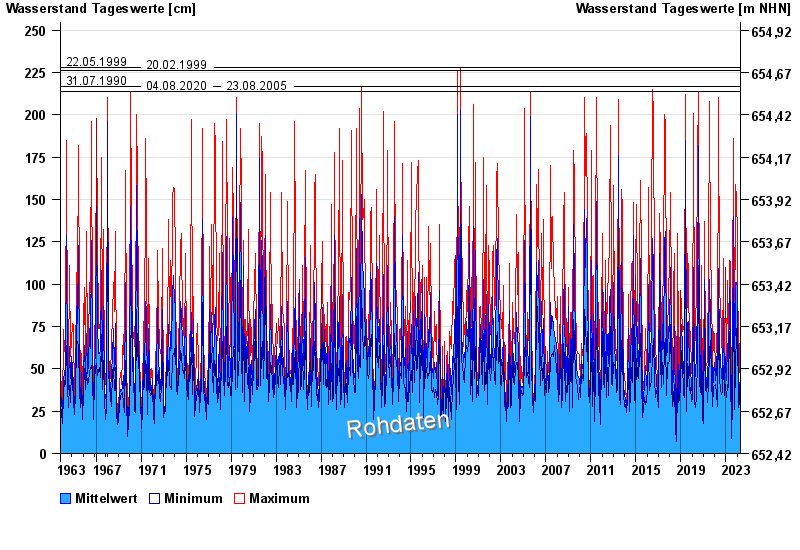
- 22.05.1999 Wasserstand: 228 cm
- 20.02.1999 Wasserstand: 226 cm
- 31.07.1990 Wasserstand: 217 cm
- 04.08.2020 Wasserstand: 214 cm
- 23.08.2005 Wasserstand: 214 cm
| Date | Mean value [cm] | Maximum [cm] | Minimum [cm] |
|---|---|---|---|
| 19.04.2024 | 25 | 29 | 22 |
| 18.04.2024 | 21 | 30 | 17 |
| 17.04.2024 | 13 | 20 | 11 |
| 16.04.2024 | 11 | 13 | 11 |
| 15.04.2024 | 10 | 11 | 10 |
| 14.04.2024 | 10 | 11 | 10 |
| 13.04.2024 | 11 | 11 | 11 |
© Bayerisches Landesamt für Umwelt 2024