
- Start >
- Rivers >
- Waterlevel >
- Bayern >
- Moosburg >
- Chart of year

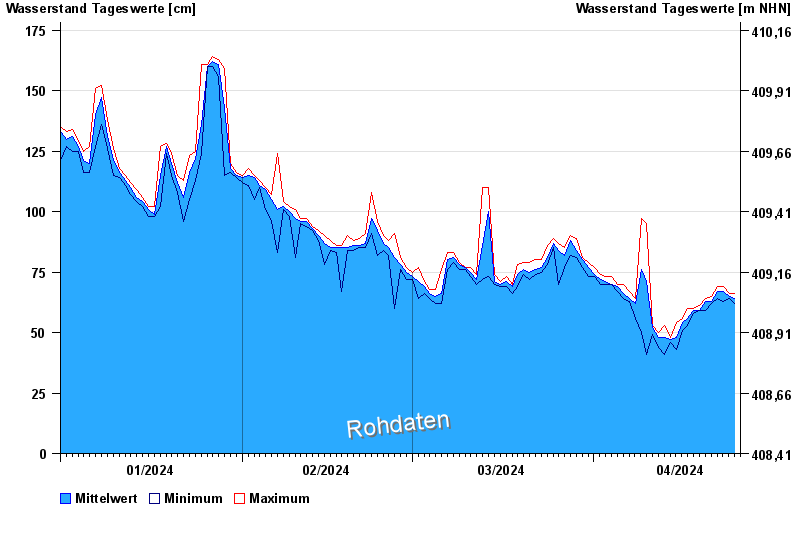
Chart of year Moosburg / Amper
Waterlevel from 01.01.2024 to 25.04.2024
- 05.06.2013 Wasserstand: 363 cm
- 08.08.2010 Wasserstand: 272 cm
- 04.06.2010 Wasserstand: 257 cm
- 03.02.2013 Wasserstand: 242 cm
- 15.01.2019 Wasserstand: 241 cm
| Date | Mean value [cm] | Maximum [cm] | Minimum [cm] |
|---|---|---|---|
| 25.04.2024 | 65 | 66 | 64 |
| 24.04.2024 | 65 | 66 | 64 |
| 23.04.2024 | 67 | 69 | 63 |
| 22.04.2024 | 67 | 69 | 64 |
| 21.04.2024 | 63 | 65 | 62 |
| 20.04.2024 | 63 | 64 | 59 |
| 19.04.2024 | 59 | 61 | 59 |
© Bayerisches Landesamt für Umwelt 2024