
- Start >
- Rivers >
- Waterlevel >
- Bayern >
- Lorenzreuth >
- Chart of total period

Chart of total period Lorenzreuth / Röslau
Waterlevel from 08.03.1965 to 25.04.2024
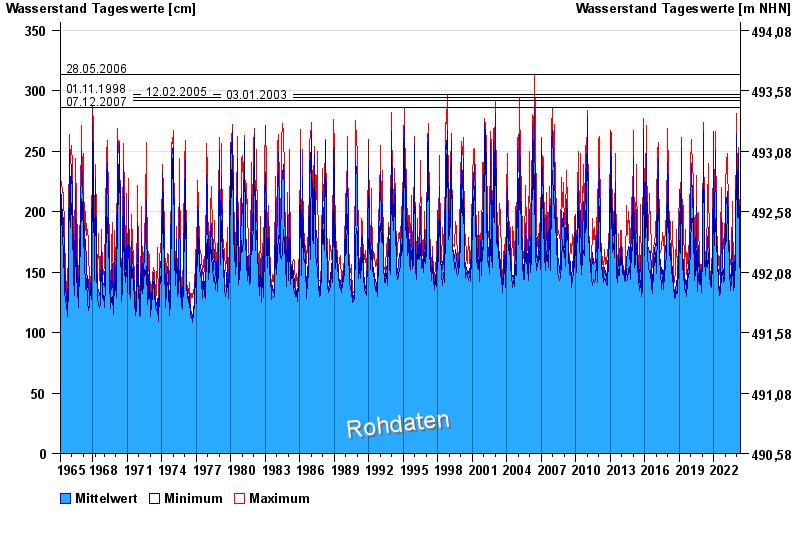
- 28.05.2006 Wasserstand: 313 cm
- 01.11.1998 Wasserstand: 297 cm
- 12.02.2005 Wasserstand: 294 cm
- 03.01.2003 Wasserstand: 292 cm
- 07.12.2007 Wasserstand: 286 cm
| Date | Mean value [cm] | Maximum [cm] | Minimum [cm] |
|---|---|---|---|
| 25.04.2024 | 150 | 151 | 149 |
| 24.04.2024 | 151 | 153 | 150 |
| 23.04.2024 | 155 | 159 | 153 |
| 22.04.2024 | 159 | 163 | 157 |
| 21.04.2024 | 161 | 165 | 159 |
| 20.04.2024 | 162 | 166 | 158 |
| 19.04.2024 | 148 | 157 | 143 |
© Bayerisches Landesamt für Umwelt 2024