
- Start >
- Rivers >
- Waterlevel >
- Bayern >
- Lorenzreuth >
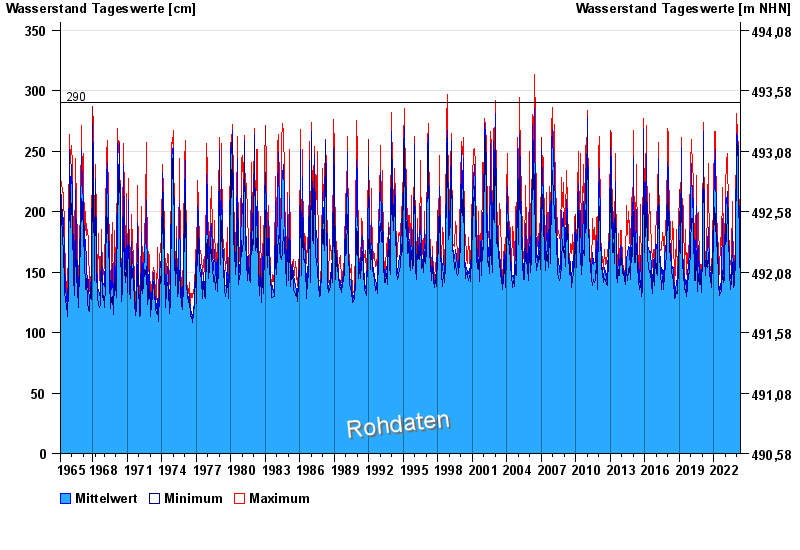
- Chart of total period

Chart of total period Lorenzreuth / Röslau
Waterlevel from 08.03.1965 to 23.04.2024
 Für diesen Pegel sind keine Hochwassermarken hinterlegt.
| Date | Mean value [cm] | Maximum [cm] | Minimum [cm] |
|---|---|---|---|
| 23.04.2024 | 157 | 159 | 155 |
| 22.04.2024 | 159 | 163 | 157 |
| 21.04.2024 | 161 | 165 | 159 |
| 20.04.2024 | 162 | 166 | 158 |
| 19.04.2024 | 148 | 157 | 143 |
| 18.04.2024 | 145 | 147 | 142 |
| 17.04.2024 | 148 | 151 | 145 |
© Bayerisches Landesamt für Umwelt 2024