
- Start >
- Rivers >
- Waterlevel >
- Bayern >
- Lierheim >
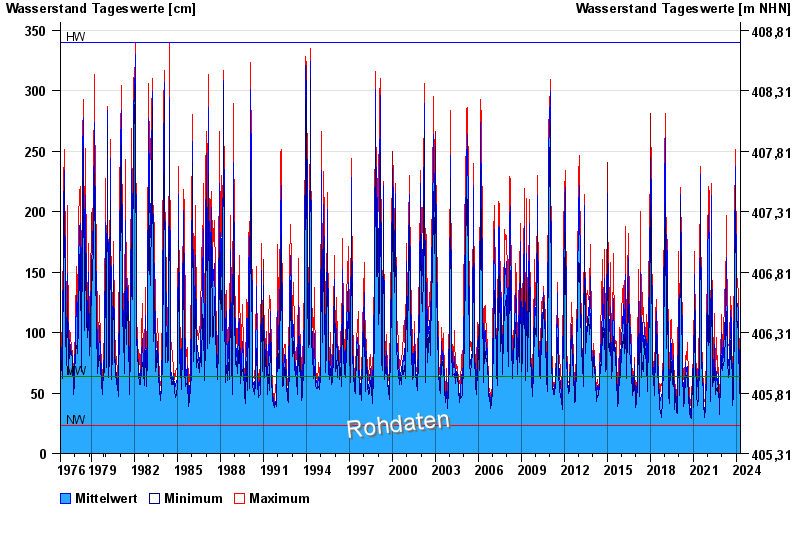
- Chart of total period

Chart of total period Lierheim / Eger
Waterlevel from 01.11.1976 to 20.04.2024
note
Abflussermittlung beeinflusst!
| Date | Mean value [cm] | Maximum [cm] | Minimum [cm] |
|---|---|---|---|
| 20.04.2024 | 49 | 49 | 48 |
| 19.04.2024 | 47 | 49 | 46 |
| 18.04.2024 | 52 | 57 | 49 |
| 17.04.2024 | 58 | 72 | 44 |
| 16.04.2024 | 42 | 44 | 41 |
| 15.04.2024 | 41 | 44 | 40 |
| 14.04.2024 | 41 | 42 | 40 |
© Bayerisches Landesamt für Umwelt 2024