
- Start >
- Rivers >
- Waterlevel >
- Bayern >
- Langenau >
- Chart of total period

Chart of total period Langenau / Langenaubach
Waterlevel from 26.10.1964 to 20.04.2024
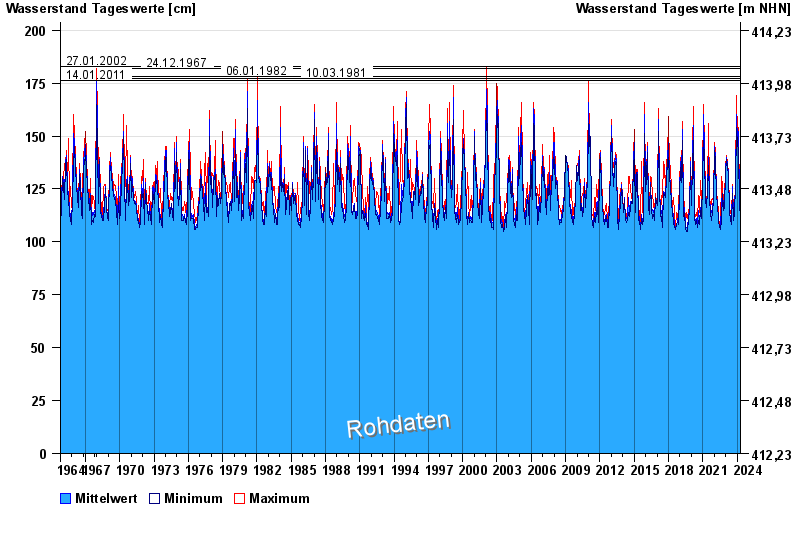
- 27.01.2002 Wasserstand: 183 cm
- 24.12.1967 Wasserstand: 182 cm
- 06.01.1982 Wasserstand: 178 cm
- 10.03.1981 Wasserstand: 177 cm
- 14.01.2011 Wasserstand: 176 cm
| Date | Mean value [cm] | Maximum [cm] | Minimum [cm] |
|---|---|---|---|
| 20.04.2024 | 117 | 118 | 117 |
| 19.04.2024 | 115 | 118 | 113 |
| 18.04.2024 | 114 | 115 | 112 |
| 17.04.2024 | 114 | 115 | 113 |
| 16.04.2024 | 114 | 117 | 113 |
| 15.04.2024 | 113 | 113 | 113 |
| 14.04.2024 | 113 | 113 | 113 |
© Bayerisches Landesamt für Umwelt 2024