
- Start >
- Rivers >
- Waterlevel >
- Bayern >
- Hobbach >
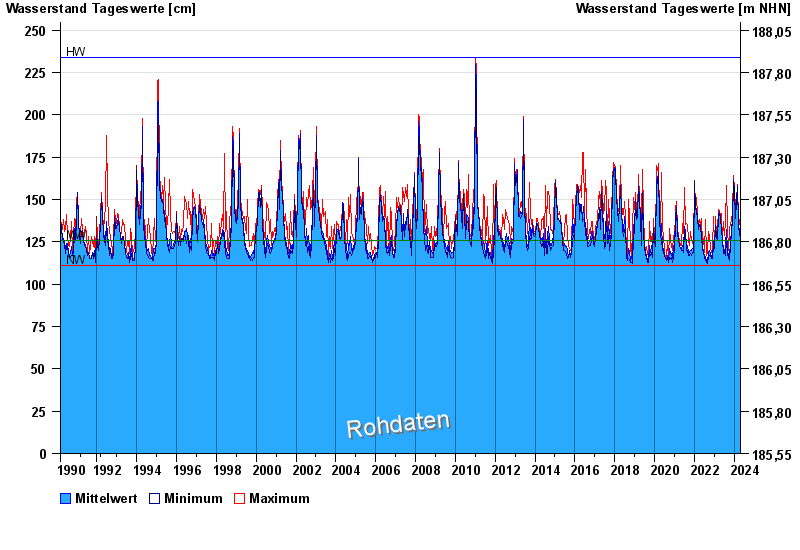
- Chart of total period

Chart of total period Hobbach / Elsava
Waterlevel from 05.03.1990 to 25.04.2024
| Date | Mean value [cm] | Maximum [cm] | Minimum [cm] |
|---|---|---|---|
| 25.04.2024 | 136 | 137 | 135 |
| 24.04.2024 | 135 | 137 | 133 |
| 23.04.2024 | 133 | 134 | 132 |
| 22.04.2024 | 132 | 133 | 132 |
| 21.04.2024 | 133 | 135 | 130 |
| 20.04.2024 | 131 | 133 | 130 |
| 19.04.2024 | 132 | 141 | 128 |
© Bayerisches Landesamt für Umwelt 2024