
- Start >
- Rivers >
- Waterlevel >
- Bayern >
- Hobbach >
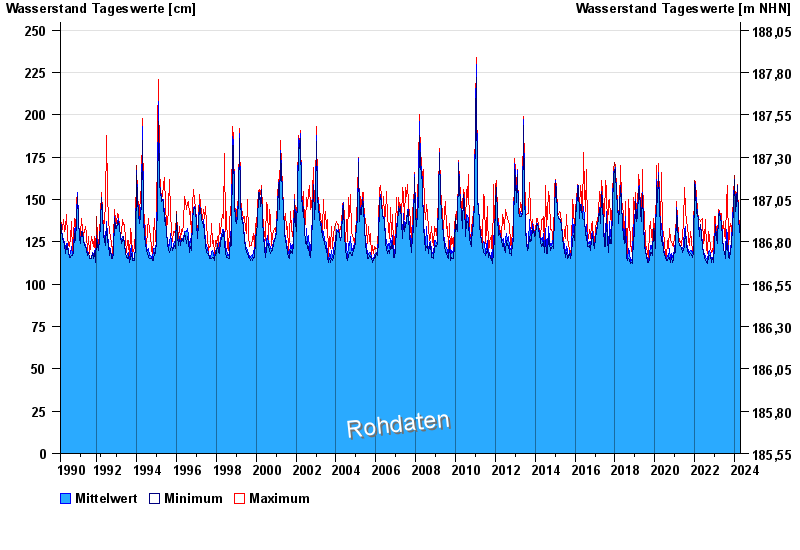
- Chart of total period

Chart of total period Hobbach / Elsava
Waterlevel from 05.03.1990 to 19.04.2024
 Für diesen Pegel sind keine Hochwassermarken hinterlegt.
| Date | Mean value [cm] | Maximum [cm] | Minimum [cm] |
|---|---|---|---|
| 19.04.2024 | 129 | 132 | 128 |
| 18.04.2024 | 129 | 130 | 128 |
| 17.04.2024 | 130 | 131 | 129 |
| 16.04.2024 | 130 | 135 | 129 |
| 15.04.2024 | 128 | 130 | 127 |
| 14.04.2024 | 127 | 127 | 126 |
| 13.04.2024 | 126 | 126 | 125 |
© Bayerisches Landesamt für Umwelt 2024