
- Start >
- Rivers >
- Waterlevel >
- Bayern >
- Heinersdorf >
- Chart of year

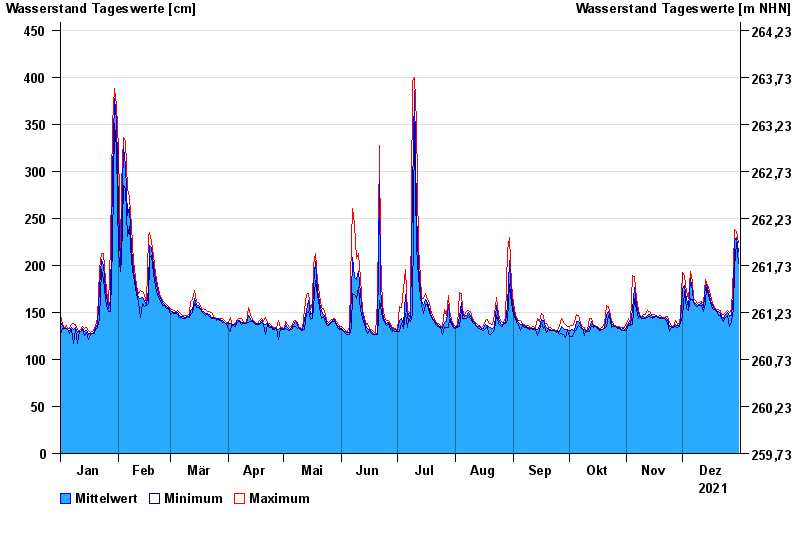
Chart of year Heinersdorf / Rodach
Waterlevel from 01.01.2021 to 31.12.2021
| Date | Mean value [cm] | Maximum [cm] | Minimum [cm] |
|---|---|---|---|
| 31.12.2021 | 215 | 224 | 202 |
| 30.12.2021 | 230 | 236 | 224 |
| 29.12.2021 | 225 | 238 | 198 |
| 28.12.2021 | 169 | 198 | 153 |
| 27.12.2021 | 147 | 153 | 140 |
| 26.12.2021 | 146 | 150 | 135 |
| 25.12.2021 | 150 | 152 | 147 |
© Bayerisches Landesamt für Umwelt 2024