
- Start >
- Rivers >
- Waterlevel >
- Bayern >
- Heinersdorf >
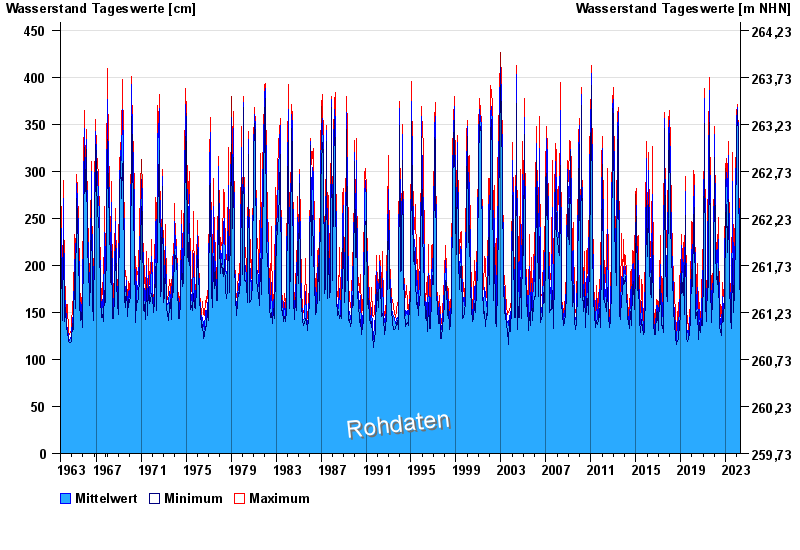
- Chart of total period

Chart of total period Heinersdorf / Rodach
Waterlevel from 28.10.1963 to 24.04.2024
| Date | Mean value [cm] | Maximum [cm] | Minimum [cm] |
|---|---|---|---|
| 24.04.2024 | 155 | 157 | 153 |
| 23.04.2024 | 159 | 163 | 157 |
| 22.04.2024 | 167 | 175 | 160 |
| 21.04.2024 | 177 | 184 | 167 |
| 20.04.2024 | 176 | 183 | 168 |
| 19.04.2024 | 155 | 174 | 150 |
| 18.04.2024 | 152 | 155 | 151 |
© Bayerisches Landesamt für Umwelt 2024