
- Start >
- Rivers >
- Waterlevel >
- Bayern >
- Hallerndorf >
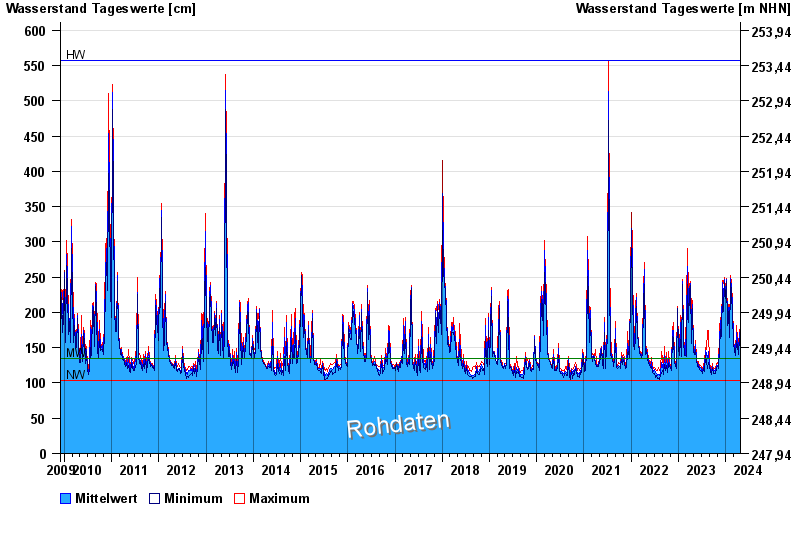
- Chart of total period

Chart of total period Hallerndorf / Aisch
Waterlevel from 02.12.2009 to 25.04.2024
| Date | Mean value [cm] | Maximum [cm] | Minimum [cm] |
|---|---|---|---|
| 25.04.2024 | 142 | 143 | 142 |
| 24.04.2024 | 145 | 148 | 143 |
| 23.04.2024 | 157 | 166 | 149 |
| 22.04.2024 | 171 | 176 | 163 |
| 21.04.2024 | 157 | 162 | 151 |
| 20.04.2024 | 152 | 160 | 141 |
| 19.04.2024 | 136 | 140 | 134 |
© Bayerisches Landesamt für Umwelt 2024