
- Start >
- Rivers >
- Waterlevel >
- Bayern >
- Güntersthal >
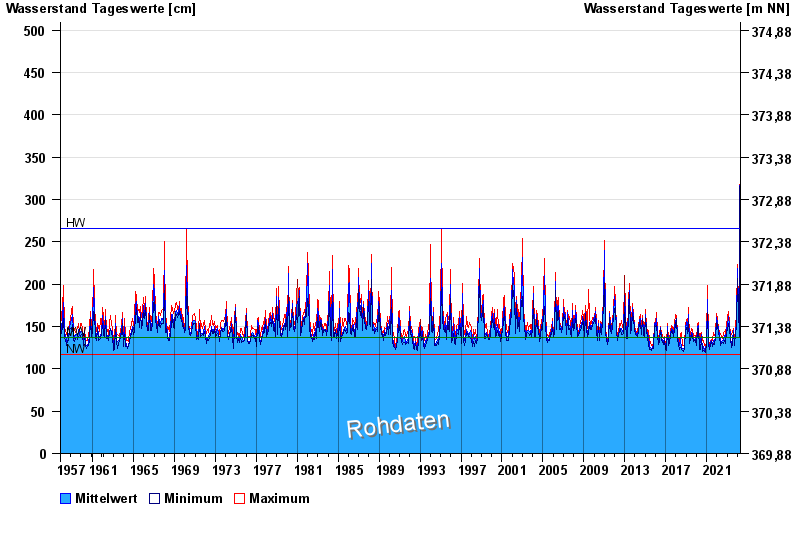
- Chart of total period

Chart of total period Güntersthal / Pegnitz
Waterlevel from 04.11.1957 to 25.04.2024
| Date | Mean value [cm] | Maximum [cm] | Minimum [cm] |
|---|---|---|---|
| 25.04.2024 | 140 | 141 | 136 |
| 24.04.2024 | 141 | 144 | 139 |
| 23.04.2024 | 145 | 150 | 141 |
| 22.04.2024 | 149 | 155 | 143 |
| 21.04.2024 | 146 | 148 | 141 |
| 20.04.2024 | 144 | 148 | 139 |
| 19.04.2024 | 139 | 143 | 137 |
© Bayerisches Landesamt für Umwelt 2024