
- Start >
- Rivers >
- Waterlevel >
- Bayern >
- Güntersthal >
- Chart of total period

Chart of total period Güntersthal / Pegnitz
Waterlevel from 04.11.1957 to 19.04.2024
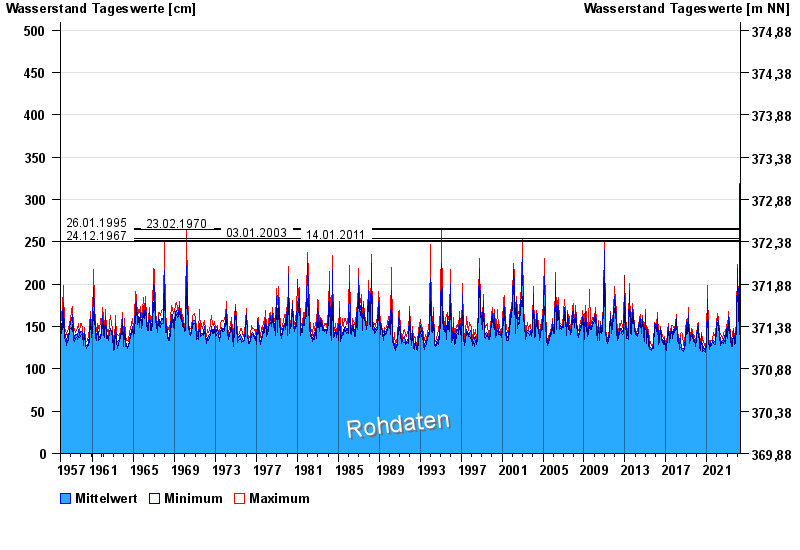
- 26.01.1995 Wasserstand: 266 cm
- 23.02.1970 Wasserstand: 265 cm
- 03.01.2003 Wasserstand: 254 cm
- 14.01.2011 Wasserstand: 252 cm
- 24.12.1967 Wasserstand: 250 cm
| Date | Mean value [cm] | Maximum [cm] | Minimum [cm] |
|---|---|---|---|
| 19.04.2024 | 138 | 138 | 138 |
| 18.04.2024 | 137 | 139 | 132 |
| 17.04.2024 | 138 | 140 | 135 |
| 16.04.2024 | 135 | 137 | 134 |
| 15.04.2024 | 134 | 135 | 134 |
| 14.04.2024 | 134 | 135 | 134 |
| 13.04.2024 | 134 | 135 | 134 |
© Bayerisches Landesamt für Umwelt 2024