
- Start >
- Rivers >
- Waterlevel >
- Bayern >
- Goldbach >
- Chart of year

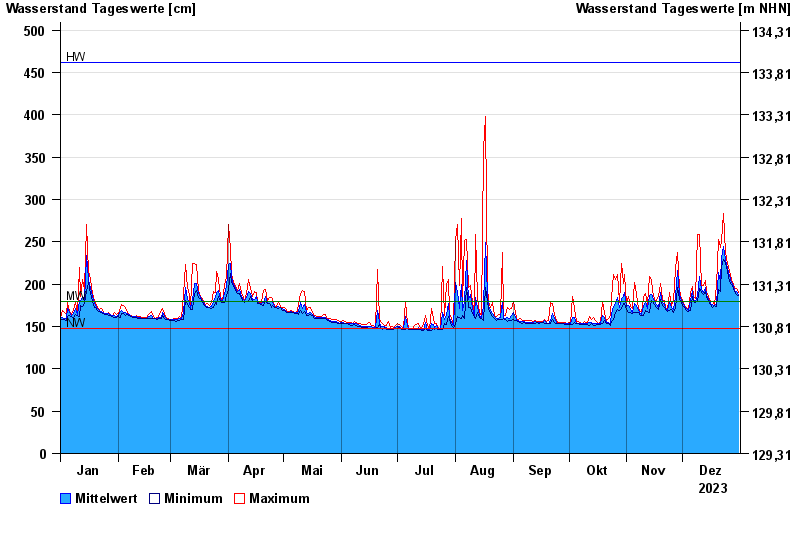
Chart of year Goldbach / Aschaff
Waterlevel from 01.01.2023 to 31.12.2023
| Date | Mean value [cm] | Maximum [cm] | Minimum [cm] |
|---|---|---|---|
| 31.12.2023 | 188 | 190 | 187 |
| 30.12.2023 | 191 | 195 | 188 |
| 29.12.2023 | 193 | 195 | 191 |
| 28.12.2023 | 198 | 200 | 195 |
| 27.12.2023 | 202 | 205 | 200 |
| 26.12.2023 | 210 | 215 | 203 |
| 25.12.2023 | 219 | 225 | 215 |
© Bayerisches Landesamt für Umwelt 2024