
- Start >
- Rivers >
- Waterlevel >
- Bayern >
- Goldbach >
- Chart of year

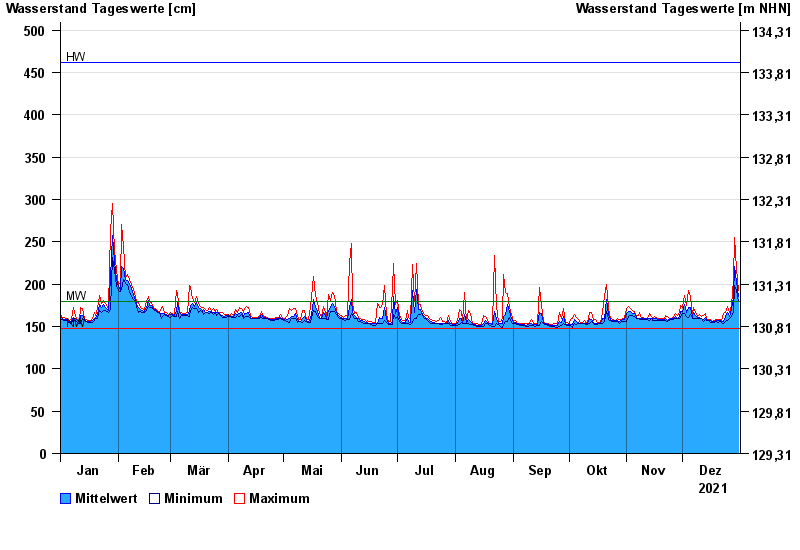
Chart of year Goldbach / Aschaff
Waterlevel from 01.01.2021 to 31.12.2021
| Date | Mean value [cm] | Maximum [cm] | Minimum [cm] |
|---|---|---|---|
| 31.12.2021 | 186 | 192 | 180 |
| 30.12.2021 | 203 | 218 | 192 |
| 29.12.2021 | 221 | 255 | 199 |
| 28.12.2021 | 185 | 206 | 167 |
| 27.12.2021 | 170 | 175 | 162 |
| 26.12.2021 | 162 | 167 | 160 |
| 25.12.2021 | 166 | 174 | 157 |
© Bayerisches Landesamt für Umwelt 2024